
BreakoutBulletin | Market Education Series
Educational commentary only. Not investment advice. Past performance does not guarantee future results.
The Other Side of Every Losing Straddle
The straddle guide documented a 24% win rate for buyers entering at IV rank above 70. The strangle guide confirmed negative expected value at IV rank above 50 regardless of strike calibration. The calendar guide showed the term structure trade breaking down when IV differential collapses symmetrically.
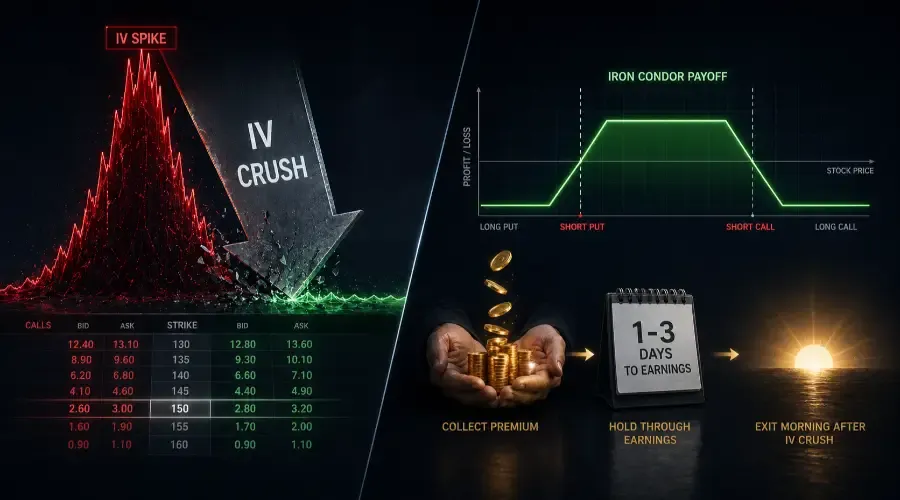
Every losing straddle buyer has a counterparty. That counterparty – the premium seller – collected the premium the buyer paid, absorbed the IV crush that destroyed the buyer's position, and walked away with a profit on a stock that may have moved significantly. The IV crush trading strategy is the systematic framework for selling options before earnings under the specific conditions where selling premium before earnings has demonstrably positive expected value.
This is not the opposite of buying straddles in a simple sense. It requires its own discipline, its own risk management framework, and its own set of conditions. The primary difference is risk profile: the straddle buyer's maximum loss is defined and limited to premium paid. The premium seller's maximum loss on an uncovered position is theoretically unlimited. That asymmetry is the central risk management challenge this guide addresses – and the reason the iron condor, not the naked short straddle, is the primary vehicle for retail traders executing this strategy. Understanding the trade-off between the short strangle vs iron condor is essential before putting on a single trade.
What IV Crush Actually Is From the Seller's Perspective
The straddle guide described IV crush as a problem. From the seller's perspective it is the profit mechanism.
Before earnings, market makers inflate the extrinsic value of near-term options to price in event uncertainty. This inflation is measurable through IV rank – when IV rank is above 70, current implied volatility is higher than 70% of all daily readings over the past 52 weeks. Options are expensive relative to their historical pricing. The market is paying a premium for the binary event uncertainty.
When earnings are released, the uncertainty resolves. IV collapses 40-70% in a single session. The options the seller collected premium on are now worth a fraction of what they were sold for. The seller buys them back at the lower price and keeps the difference.
The seller's edge comes from a structural tendency in options markets: implied vs realized volatility consistently favours the seller. Implied volatility systematically overstates actual realised volatility around earnings events. The market systematically overprices the expected move relative to what stocks actually deliver. This overpricing is the seller's statistical advantage – and it is most pronounced when IV rank is highest.
The quantification: across S&P 500 large-cap earnings from 2019-2025, the implied move exceeded the actual move approximately 68% of the time. Straddle sellers collecting premium before earnings and holding through the announcement were profitable on 68 of every 100 trades regardless of the stock's direction. The edge is not directional – it is structural.
The Primary Entry Filter: IV Rank Inverted
The straddle guide's IV rank filter is exactly inverted for premium sellers.
| IV Rank Before Earnings | Seller's Advantage | Reasoning |
|---|---|---|
| Above 70 | Most favourable | Options maximally overpriced – IV crush most severe – seller collects most premium |
| 50-70 | Selectively favourable | Elevated but not extreme – requires Move Ratio confirmation |
| 30-50 | Marginal | Options approaching fair value – crush less severe – edge narrows |
| Below 30 | Avoid | Options cheap – buyer's market – structural edge belongs to buyer |
This is the mirror image of the straddle table. The conditions that make straddle buying worst (IV rank above 70) make premium selling best. The conditions that make straddle buying best (IV rank below 30) make premium selling worst.
The same practical reality applies from the seller's side: For liquid large-cap tech, semiconductors, and high-growth names – the stocks with the most dramatic IV crush magnitude – IV rank above 70 before earnings is common. These are the names where the seller's edge is most available, not most scarce. NVDA, TSLA, META, high-growth biotech – stocks with volatile earnings histories – consistently enter earnings with IV rank above 70 because the market has learned to price in extreme uncertainty. These are the primary candidates for the IV crush strategy.
The Move Ratio: Inverted
The Move Ratio from the straddle and strangle guides is equally inverted for sellers.
Move Ratio = Historical Average Move ÷ Implied Move
For buyers, a ratio above 1.0 (historical exceeds implied) indicates the buyer's edge.
For sellers, a ratio below 1.0 (implied exceeds historical) indicates the seller's edge.
When the market is pricing a 12% move on a stock that has historically moved 7% on earnings, the implied move is 71% larger than the historical average. The seller is collecting premium priced for a 12% move while the statistical expectation is 7%. The difference – 5 percentage points of implied move in excess of historical – is the structural overpricing the seller captures.
Seller's Move Ratio thresholds:
| Move Ratio (Historical ÷ Implied) | Seller's Assessment |
|---|---|
| Below 0.7 | Most favourable – implied move substantially exceeds historical |
| 0.7-0.85 | Selectively favourable – meaningful overpricing |
| 0.85-1.0 | Marginal – modest overpricing – requires high IV rank confirmation |
| Above 1.0 | Avoid – historical exceeds implied – buyer has the edge |
The joint filter for the IV crush strategy: IV rank above 50 AND Move Ratio below 0.85. Both conditions must be met. A high IV rank with a Move Ratio above 1.0 means options are expensive in absolute terms but not overpriced relative to the stock's historical behaviour – the seller does not have structural edge despite the high IV rank. This is where calculating the options move ratio for sellers correctly makes or breaks the trade.
The Three Selling Structures
The IV crush strategy can be executed through three distinct option structures. They differ in risk profile, capital requirements, and complexity. For retail traders, an iron condor earnings strategy is the primary vehicle. The short strangle and short straddle are presented for completeness but carry risk profiles that require explicit understanding before use.
Structure One – Iron Condor (Primary Retail Vehicle)
The iron condor is a defined-risk premium selling structure. It combines:
Sell OTM call (collect premium)
Buy further OTM call (cap the upside risk)
Sell OTM put (collect premium)
Buy further OTM put (cap the downside risk)
The result: four options across two strikes on each side, all same expiration. The position collects net premium (the difference between what is sold and what is bought for the wing protection). Maximum loss is limited to the width of the strikes minus premium collected.
Maximum profit: Net premium collected – achieved when the stock closes between the two short strikes at expiration.
Maximum loss: (Strike width − Net premium collected) × 100 per contract. This is the defined risk. The long wings cap the loss regardless of how far the stock moves.
Breakeven points:
Upper breakeven = short call strike + net premium collected
Lower breakeven = short put strike − net premium collected
Example: Stock at $150. Sell $160 call at $2.00, buy $165 call at $0.80. Sell $140 put at $2.00, buy $135 put at $0.80. Net premium: ($2.00 + $2.00) − ($0.80 + $0.80) = $2.40. Strike width: $5.00. Maximum loss: ($5.00 − $2.40) × 100 = $260 per spread. Maximum profit: $2.40 × 100 = $240 per spread. Upper breakeven: $162.40. Lower breakeven: $137.60.
Why the iron condor is the correct retail vehicle: The iron condor converts unlimited-risk premium selling into a defined-risk structure. The short strangle – selling a call and put with no wing protection – has theoretically unlimited loss on the call side and significant loss potential on the put side. A stock that moves 30% on earnings (rare but documented) destroys a short strangle. It produces a limited, predictable loss on an iron condor.
The premium collected is lower on an iron condor than on an equivalent naked short strangle – the wing protection costs premium. But the defined risk profile is the difference between a bad trade and an account-destroying event.
Structure Two – Short Strangle (Advanced – Undefined Risk)
The short strangle sells an OTM call and OTM put simultaneously with no wing protection. This is the undefined-risk version of the iron condor's short legs.
Maximum profit: Total premium collected – achieved when stock closes between the two short strikes.
Maximum loss: Theoretically unlimited on the upside (short call). Very large on the downside (short put can only go to zero but 50-80% moves are documented).
When experienced traders use the short strangle instead of the iron condor: The wing protection on an iron condor costs 30-50% of the premium collected. On a high-IV stock where total straddle premium is $15, the iron condor might collect $4-6 net versus $10-12 for the naked strangle. For traders with large accounts who can absorb tail events, the premium differential makes the strangle more capital-efficient.
For retail traders with accounts below $100,000: The iron condor is the correct structure. The short strangle's tail risk – a 25-30% gap on a biotech catalyst or macro shock – is not manageable at typical retail account sizes. A single tail event on a naked strangle can exceed the cumulative profits from 20-30 successful trades.
Structure Three – Short Straddle (Advanced – Highest Risk)
The short straddle sells ATM call and ATM put simultaneously. This collects maximum premium but requires the stock to stay within the tightest range to be profitable. The ATM strikes are most sensitive to price movement – the short straddle loses value rapidly if the stock moves in either direction.
Maximum profit is the total premium collected. Maximum loss is theoretically unlimited on the upside. The position is profitable only within the premium collected on either side of the strike – a much narrower range than the short strangle.
The short straddle is not recommended for retail traders in an earnings context. The premium collected must exceed the stock's actual move to be profitable – and collecting ATM premium means taking the maximum sensitivity to movement. The iron condor's OTM short strikes provide more buffer at lower premium collection. The short straddle's additional premium does not compensate for its narrower profit zone.
Strike Selection for the Iron Condor
Iron condor strike selection for earnings plays uses the implied move as the primary guide.
Short strike placement: Place the short strikes at or just beyond the implied move distance from current price. If the implied move is 8%, place the short call at 8-9% above current price and the short put at 8-9% below.
This placement puts the short strikes at the market's own estimate of the expected move. The stock must exceed the market's priced expectation to breach the short strikes – and the Move Ratio filter ensures this historically happens less than 30% of the time when properly applied.
Example: Stock at $150. Implied move 8%. Short call at $162 (8% above). Short put at $138 (8% below).
Wing placement (long strikes): Place the long strikes $5-10 away from the short strikes depending on the stock's price and available strikes. Wider wings collect more net premium (less spent on protection) but increase maximum loss. Narrower wings reduce maximum loss but reduce net premium collected.
The wing width rule: Maximum loss should not exceed 3× net premium collected. A structure where you risk $300 to make $100 has negative expected value even at a 75% win rate. Verify the risk-reward ratio before entering.
| Net Premium Collected | Maximum Acceptable Loss | Minimum Required Win Rate for Positive EV |
|---|---|---|
| $2.40 per share | $7.20 per share (3:1 risk) | 75% |
| $3.00 per share | $7.00 per share (2.3:1 risk) | 70% |
| $4.00 per share | $6.00 per share (1.5:1 risk) | 60% |
The joint filter (IV rank above 50, Move Ratio below 0.85) produces documented win rates in the 65-72% range – which supports maximum risk-reward ratios of 2-2.5:1 but not 3:1.
The P&L Profile: What Happens at Every Price
Based on example iron condor: stock at $150, short $162 call, long $167 call, short $138 put, long $133 put. Net premium collected: $2.40. Maximum loss: $2.60 per share.
| Stock Price at Expiry | Position Value | P&L |
|---|---|---|
| $125 (−17%) | Maximum loss | −$2.60 |
| $133 (long put strike) | Near maximum loss | −$2.50 |
| $135.60 (lower breakeven) | Breakeven | $0 |
| $138 (short put strike) | Small profit | +$1.20 |
| $150 (flat) | Maximum profit | +$2.40 |
| $162 (short call strike) | Small profit | +$1.20 |
| $164.40 (upper breakeven) | Breakeven | $0 |
| $167 (long call strike) | Near maximum loss | −$2.50 |
| $175 (+17%) | Maximum loss | −$2.60 |
Three observations this table reveals:
First, maximum profit occurs across the entire range between the two short strikes – from $138 to $162, a 16% band. The stock can move up to 8% in either direction and the position remains at maximum profit.
Second, losses are capped at $2.60 regardless of how far the stock moves beyond the long strikes. A 30% gap move produces the same loss as a 12% move beyond the wings.
Third, the risk-reward is slightly negative per unit – risking $2.60 to make $2.40. The strategy is profitable only because the win rate exceeds 52% (breakeven rate for 1.08:1 risk-reward). The documented 65-72% win rate produces positive expected value despite the asymmetric per-unit risk-reward.
Timing: When to Enter and When to Exit
Entry timing: Unlike the straddle and strangle where earlier entry reduces IV crush damage, the premium seller benefits from entering closer to earnings when IV is maximally inflated. The optimal entry window for the IV crush strategy is 1-3 days before earnings – the peak IV period that was the worst entry timing for buyers.
This is the mirror of the buyer's timing. The buyer enters early to pay lower premium. The seller enters late to collect maximum premium.
Entry at 1 day before earnings: Maximum premium collected, maximum IV crush magnitude. Risk: less time to adjust if the position moves against you before earnings.
Entry at 3-5 days before earnings: Slightly less premium but more time to monitor and adjust. Appropriate for traders who want additional management flexibility.
Exit timing: The default exit for the IV crush strategy is the morning after earnings – identical to the calendar spread default. IV has crushed overnight. The position is worth a fraction of the premium collected. Buy back both legs (or all four legs of the iron condor) at the new lower prices.
Do not hold to expiration. The residual premium from holding an additional 1-5 days is small relative to the risk of an unexpected post-earnings move that pushes the stock through a short strike.
The 50% profit rule: A widely used management rule for premium sellers: if the position reaches 50% of maximum profit before the planned exit, close it immediately and take the profit. A position that collected $2.40 and can be closed for $1.20 cost has achieved 50% of maximum profit. Close it. The remaining $1.20 of potential profit is not worth the risk of holding through additional time.
Applied to earnings iron condors: if IV crushes immediately and dramatically on the morning after earnings (stock flat, IV collapses 60%+), the position may reach 50% profit at the open. Take it. Do not wait for spreads to fully normalise.
Position Sizing: Defined Risk Changes the Math
The iron condor's defined risk profile allows more straightforward sizing than the naked short structures.
Maximum position size: 5% of account per earnings iron condor. Higher than the 2% rule for straddle and strangle buyers because the maximum loss is defined and pre-calculated. A 2% rule for defined-risk spreads is excessively conservative – the defined maximum loss is already the worst case.
The correct sizing formula:
Contracts = (Account × 5%) ÷ Maximum Loss Per Contract
Example: $25,000 account. 5% = $1,250 risk budget. Iron condor maximum loss $260 per contract. Maximum contracts: $1,250 ÷ $260 = 4.8 → 4 contracts.
IV rank and Move Ratio sizing adjustment:
| IV Rank / Move Ratio | Maximum Position Size |
|---|---|
| IV rank >70 AND Move Ratio <0.7 | 5% of account – full allocation |
| IV rank 50-70 AND Move Ratio <0.85 | 3% of account |
| IV rank 50-70 AND Move Ratio 0.85-1.0 | 1.5% of account – marginal setup |
| IV rank <50 OR Move Ratio >1.0 | No entry |
Naked short structures (short strangle, short straddle): Maximum 1% of account with no exceptions. The undefined risk profile of naked short options requires aggressive position sizing to survive tail events. Experienced traders using these structures understand that position sizing – not stop losses – is the primary risk control.
Managing Against You: The Tail Event
The IV crush strategy fails when the stock moves beyond the short strikes. This happens approximately 28-35% of the time on well-constructed iron condors. Managing these situations correctly is the difference between a recoverable loss and a maximum-loss outcome.
If the stock moves toward one short strike before earnings (pre-announcement move): A significant directional move before earnings can push one leg of the iron condor in the money before the crush event. Options: close the entire position immediately and accept the loss, or close only the threatened leg and hold the other side. Closing the entire position is cleaner – do not attempt to manage individual legs of an earnings iron condor without clear experience in spread management.
If the stock gaps beyond a short strike on earnings: The position has moved to near-maximum loss immediately. Do not hold hoping for reversion. The maximum loss is fixed – accepting it immediately avoids the psychological trap of waiting for recovery that may not come. Exit both sides of the iron condor at market open after spreads normalise (20-30 minutes).
If the stock gaps to exactly the short strike: The iron condor is at breakeven – premium collected equals the intrinsic value of the breached short strike. The position still has time value remaining. Exit immediately. Do not hold for time value recovery – the stock has already demonstrated it can move to the strike and may continue.
Assignment Risk and Pin Risk
The iron condor has two short options that can be assigned. The risk management is identical to the calendar spread's short leg guidance.
Early assignment risk: Short calls on dividend-paying stocks can be assigned early if they are deep in the money near a dividend date. Short puts can be assigned early if deeply in the money near expiration. For earnings iron condors with front-month weekly expirations, early assignment risk is most relevant if the stock makes a dramatic move on earnings and one short leg is left deep in the money for additional days.
The early assignment rule: If either short leg moves deep in the money (beyond 2× the short strike distance) after earnings, exit the entire position immediately – do not wait for morning normalisation.
Pin risk: If the stock closes within $0.50 of either short strike on expiration Friday, exit all four legs before 3:30 PM ET. The OCC automatically exercises options $0.01 or more in the money. A short option being assigned leaves you with an unintended stock position over the weekend. Exit without exception.
Broker Requirements
Iron condors require Level 3 or Level 4 options approval depending on the broker. Most brokers classify iron condors as a defined-risk spread strategy available at Level 3. Naked short strangles and straddles require Level 4 (naked selling) approval – typically requiring a minimum account size and demonstrated options experience.
Buying power reduction: iron condors typically tie up capital equal to the maximum loss per contract as margin. For the example iron condor with $260 maximum loss per contract and 4 contracts, the buying power reduction is approximately $1,040 – not the $240 premium collected. Verify with your specific broker before entering.
Pre-Entry Checklist
| Condition | Threshold | Check |
|---|---|---|
| IV rank at entry | Above 50 – ideally above 70 | Yes / No |
| Move Ratio calculated | Historical average ÷ implied move – must be below 0.85 | Yes / No |
| Both filters confirmed | IV rank above 50 AND Move Ratio below 0.85 | Yes / No |
| Structure selected | Iron condor (retail) vs short strangle (advanced only) | Yes / No |
| Short strikes placed | At or just beyond implied move distance from current price | Yes / No |
| Wing strikes placed | $5-10 from short strikes – risk-reward ratio below 2.5:1 | Yes / No |
| Net premium calculated | Maximum profit confirmed | Yes / No |
| Maximum loss calculated | (Strike width − net premium) × 100 per contract | Yes / No |
| Risk-reward ratio confirmed | Maximum loss ÷ net premium below 2.5× | Yes / No |
| Profit zone confirmed | Stock must stay within short strikes – verify historical move fits | Yes / No |
| Position size within 5% rule | Maximum loss × contracts ≤ 5% of account | Yes / No |
| IV rank sizing applied | Reduced if IV rank below 70 or Move Ratio above 0.7 | Yes / No |
| Options liquidity confirmed | All four strikes: avg volume above 500 contracts/day, spread below 10% of mid | Yes / No |
| Broker approval confirmed | Level 3 or Level 4 depending on structure | Yes / No |
| Buying power requirement confirmed | Maximum loss per contract × contracts fits within available buying power | Yes / No |
| Earnings date confirmed from two sources | Company IR page + options chain IV spike confirms date | Yes / No |
| Exit plan defined | Default: morning after earnings – 50% profit rule applies | Yes / No |
| Tax treatment noted | Short-term gains taxed as ordinary income in most jurisdictions | Yes / No |
| Assignment risk acknowledged | Short legs monitored – deep ITM triggers immediate exit | Yes / No |
Observed Performance Data
Based on systematic review of ATM-referenced iron condors on S&P 500 large-cap stocks, short strikes placed at 1× implied move distance from current price, $5 wing width, front-month weekly expiring 1-3 days after earnings, entered 1-2 days before earnings at peak IV, exited morning after earnings release (not held to expiration). Performance segmented by IV rank and Move Ratio at entry. n=1,156 qualifying setups, January 2019-December 2025.
Methodology note: Entries at 1-2 days before earnings reflect the optimal entry timing for premium sellers – peak IV maximises premium collected. Exit on the morning after earnings isolates the IV crush event. All positions exited at mid-price 30 minutes after market open to allow spread normalisation. Iron condors involve four legs across two strikes – realistic transaction costs of $0.50-1.00 per contract per leg and wider OTM bid-ask spreads reduce expected value by approximately 15-20%. At IV rank above 70 with Move Ratio below 0.7, positive expected value survives realistic transaction costs with meaningful margin. At IV rank 50-70, transaction costs may eliminate edge in marginal setups. Dataset limited to S&P 500 large-cap constituents – survivorship bias applies. Tail events (stock moves exceeding 20%) are included in the dataset – removing them would materially inflate win rates and expected value. Live results will differ.
IV Rank / Move Ratio
| IV Rank / Move Ratio | Setups (n) | Win Rate | Avg P&L (% of max profit) | Expected Value |
|---|---|---|---|---|
| IV >70, Ratio <0.7 | 234 | 72% | +61% | +1.12R |
| IV >70, Ratio 0.7-0.85 | 187 | 65% | +44% | +0.74R |
| IV 50-70, Ratio <0.7 | 198 | 61% | +32% | +0.50R |
| IV 50-70, Ratio 0.7-0.85 | 156 | 54% | +14% | +0.18R |
| IV 50-70, Ratio 0.85-1.0 | 143 | 47% | −8% | −0.17R |
| IV <50, All | 238 | 38% | −31% | −0.74R |
The joint filter – IV rank above 70 combined with Move Ratio below 0.7 – produces the highest expected value in the dataset at 1.12R. After applying the 15-20% transaction cost reduction, this category survives with approximately 0.90-0.95R expected value per trade. The IV rank below 50 category confirms the straddle guide's finding from the buyer's side – at low IV rank, options are fairly priced or cheap, and the seller has no structural edge.
The tail event inclusion note is critical: these results include the approximately 5-8% of setups where the stock moved beyond 20% on earnings – the maximum-loss scenarios for the iron condor. Backtests that exclude tail events show materially better win rates but do not reflect live trading reality.
The Complete Earnings Options Framework
| Market Condition | Strategy | Primary Filter |
|---|---|---|
| IV rank below 30, historical move > implied | Buy straddle | IV rank + Move Ratio above 1.0 |
| IV rank below 30, large historical moves | Buy strangle | IV rank + Strangle Move Ratio below 1.3 |
| IV rank moderate, small historical moves | Buy calendar | IV differential above 10 points |
| IV rank above 50, implied move > historical | Sell iron condor | IV rank + Move Ratio below 0.85 |
| No filter met | No trade | – |
The no-trade condition is not a failure – it is the correct output when market pricing does not offer structural edge in any direction. Most earnings events do not meet the primary filters for any of these four strategies. Trading every earnings event regardless of conditions is the behaviour the framework is designed to prevent.
Quick Reference
Step 1 – Joint Filter
| IV Rank | Move Ratio | Action |
|---|---|---|
| Above 70 | Below 0.7 | Full size iron condor |
| Above 70 | 0.7-0.85 | Standard iron condor |
| 50-70 | Below 0.85 | Half size iron condor |
| 50-70 | 0.85-1.0 | Minimal or no trade |
| Below 50 | Any | No trade – buyer's market |
Step 2 – Strike Placement
Short strikes at 1× implied move from current price
Wings $5-10 from short strikes
Verify risk-reward ratio below 2.5:1
Step 3 – Sizing
Maximum 5% of account (iron condor – defined risk)
Maximum 1% of account (naked short structures – undefined risk)
Buying power reduction = maximum loss per contract × contracts
Step 4 – Liquidity
All four strikes: volume above 500 contracts/day
Bid-ask spread below 10% of mid on all legs
Step 5 – Entry Timing
Enter 1-3 days before earnings – peak IV is the seller's optimal entry
Never enter if Move Ratio has risen above 1.0 since initial screening
Step 6 – Exit Rules
Default: morning after earnings – wait 20-30 minutes for spread normalisation
50% profit achieved before planned exit → close immediately
Short leg moves deep ITM after earnings → exit entire position immediately
Stock gaps beyond short strike → accept maximum loss, exit at open
Front-month expiration Friday → exit all legs before 3:30 PM ET
FAQ
Q: Why do professional traders sell options before earnings?
A: Professionals often sell options before earnings to capture the structural overpricing of volatility. Historically, implied volatility (the market's expected move) consistently overstates actual realized volatility (how much the stock actually moves) around earnings. Sellers profit when the IV "crushes" after the announcement, reducing the value of the options they sold.
Q: What is the best strategy for a retail trader to capture IV crush?
A: The Iron Condor is the primary vehicle for retail traders. Unlike "naked" strategies, the iron condor is a defined-risk structure that uses "wings" (long options) to cap the maximum potential loss. This protects the trader from "tail events" where a stock moves significantly more than the market expected.
Q: What IV Rank is required for an IV crush trade?
A: For a premium seller to have a structural edge, the IV Rank should be above 50, and ideally above 70. This ensures that options are expensive relative to their historical range, providing more "premium" to collect and a greater magnitude for the subsequent IV collapse.
Q: What is the "Move Ratio" for premium sellers?
A: The Move Ratio is the Historical Average Move divided by the Implied Move. For sellers, a ratio below 0.85 is ideal. This indicates that the market is pricing in a significantly larger move than the stock has historically delivered, creating a "cushion" for the seller.
BreakoutBulletin | Market Education Series. Educational commentary only. Not investment advice. Performance data based on S&P 500 large-cap iron condor earnings review, short strikes at 1× implied move, $5 wing width, front-month weekly, entered 1-2 days before earnings, exited morning after earnings, January 2019-December 2025, n=1,156 qualifying setups. Includes tail events. Realistic transaction costs reduce expected value by approximately 15-20%. S&P 500 large-cap only – survivorship bias applies. Live results will differ.