
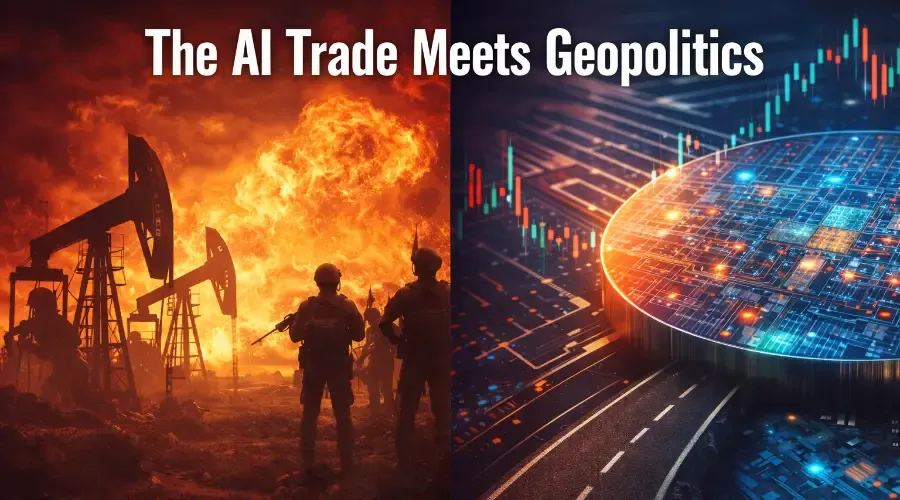
As oil and rates reprice on fresh Iran headlines and a negative jobs print, traders are reassessing crowded AI winners like NVDA and defense-flavored AI names like PLTR.
BreakoutBulletin | Market Intelligence Brief
Published: Sunday March 9, 2026
Educational commentary only. Not investment advice.
The Hook
The Financial Times put it plainly: "Iran war muddles expectations of likely Fed interest rate cuts." That single headline captures the entire macro setup heading into the week of March 9 through 13.
For months, the dominant narrative in equity markets was straightforward: the Fed is cutting, AI capex is accelerating, and NVDA is the safest bet in the most crowded trade on Wall Street.
That narrative is now under review. Not because AI fundamentals changed, but because two external shocks arrived simultaneously and changed the macro context in which AI valuations live.
The Iran-Hormuz conflict pushed WTI crude above $90-a 20 to 25 percent move in weeks. At the same time, February's Non-Farm Payrolls printed negative 92,000 jobs with unemployment rising to 4.4 percent.
Under normal circumstances, a negative jobs print would immediately send bond yields lower and strengthen the case for Fed cuts. Instead, yields rose. The 10-year Treasury climbed approximately 10 basis points on the week, settling near 4.41 percent. The 2-year, which is most sensitive to Fed expectations, rose 6 basis points to approximately 4.62 percent.
The Signal Most Traders Missed
The DXY divergence is the signal most retail traders missed.
When yields rise and the dollar weakens simultaneously, it means global investors are not attracted to US yields. They are pricing the yield rise as an inflation symptom, not a growth signal.
That is the stagflation configuration. Growth slowing. Inflation not. The Fed caught in the middle.
And the AI trade-built on low rates, abundant capital, and a Fed cutting cycle-sits directly in the crossfire.
The Feb NFP print should have driven yields lower. It drove them higher. That inversion of the normal relationship is the most important signal of the week. The bond market is telling you it fears inflation more than recession-and that changes the calculus for every high-multiple AI name.
The Macro Landscape
Several key market signals define the current environment.
WTI Crude Oil sits above $90, reflecting the Iran-Hormuz supply shock. Energy CPI is now pressured upward.
The 10-year Treasury stands near 4.41 percent, up 10 basis points on the week. The inflation risk premium is rising despite weak jobs data.
The 2-year Treasury is near 4.62 percent, up 6 basis points. The market is pricing the Fed on hold well into 2026.
CME Fed cut odds have been significantly pushed out. The oil shock is delaying the pivot timeline.
The S&P 500 declined 0.45 percent for the week. Growth and duration names led the weakness.
The Nasdaq 100 fell 0.95 percent. The AI-heavy index is most sensitive to the yield rise.
The VIX is elevated and rising. Risk premium is increasing. Options buyers are active.
The DXY dollar index fell 0.29 percent despite the yield rise. This is the stagflation signal-inflation driving yields, not growth.
NVDA - AI King in a Shakier Macro
NVDA remains the most important single stock in the AI trade. Its positioning, analyst coverage, and sensitivity to macro conditions make it the benchmark against which every other AI name is measured.
The Positioning Reality
NVDA holds approximately 90 percent or more GPU market share for AI training workloads. This is a near-monopoly position in the infrastructure layer of the AI buildout.
Wall Street reflects this dominance. Approximately 40 buy or strong-buy ratings stand against roughly 10 neutral or sell ratings. Street price targets cluster between $1,250 and $1,400 against a spot price near $1,100. That implies 14 to 27 percent upside consensus even after the recent pullback.
This is the most crowded long position in large-cap technology. When a stock has 40 buy ratings and 90 percent of a critical market, the question is not whether the business is strong—it clearly is. The question is what happens to the valuation when the macro environment that justified paying 30 to 40 times forward earnings begins to shift.
The Catalyst Trail
NVDA's last earnings report delivered another significant beat, driven by hyperscaler AI capex that showed no signs of deceleration at the time. Data center revenue continues to be the growth engine.
Microsoft, Google, Amazon, and Meta have all publicly committed to AI infrastructure spending in the hundreds of billions through 2025 and 2026. The demand side of NVDA's business is not in question.
What is in question is the valuation multiple the market is willing to assign to that demand stream when the risk-free rate—the 10-year Treasury—sits at 4.41 percent rather than 1.5 percent.
Long-duration assets, which price distant future earnings at a high present-value discount, are mathematically more sensitive to the denominator, the discount rate, than to the numerator, the earnings. NVDA is one of the most long-duration assets in the entire S&P 500.
The Macro Collision
February NFP at negative 92,000 and unemployment at 4.4 percent would historically trigger a growth scare rotation out of cyclicals and into defensives-with technology often a beneficiary as a quality growth hedge.
The Iran oil shock prevents that rotation from playing cleanly. Higher oil means higher inflation, higher yields, and a Fed that cannot cut into weakness. NVDA faces a double bind: weak enough macro to raise revenue questions at the margin, but inflationary enough macro to keep discount rates elevated.
The 10-year yield at 4.41 percent raises the discount rate and compresses DCF multiples. This is negative for NVDA.
The February NFP at negative 92,000 raises questions about consumer and enterprise caution at the margin, though hyperscaler capex remains resilient. This is neutral to mixed.
Oil above $90 increases energy costs for data centers but has no direct revenue hit. This is a mild negative.
Fed cuts pushed out mean the risk-free rate stays elevated longer and the growth premium remains compressed. This is negative.
AI capex commitments intact mean demand from hyperscalers has not wavered publicly. This is positive.
The 90 percent plus GPU share means the competitive moat remains intact regardless of macro. This is positive.
NVDA's business is stronger than ever. Its stock price is a valuation question, not a business question. And valuations are set by the discount rate-which oil and the Fed just moved in the wrong direction.
PLTR - Defense-AI Hybrid in a War Tape
While NVDA is the pure-play AI infrastructure bet, Palantir sits at a different intersection: artificial intelligence applied to defense, intelligence, and government operations. In a war tape, that distinction matters significantly.
Why PLTR Gets Grouped With Defense Names
On high-geopolitical-risk trading days-and the Iran-Hormuz conflict has produced several-Palantir appears alongside Lockheed Martin, Raytheon, and Exxon in trending tickers lists on financial platforms.
The market's instinct is correct in a structural sense. PLTR's revenue mix is approximately half government and defense contracts, with commercial AI accelerating from a smaller base.
Recent contract wins illustrate the positioning. Department of Defense contracts extending the Maven Smart System, which provides AI-assisted military intelligence. NATO partnerships for battlefield data analysis. UK National Health Service deployments in healthcare AI.
These are long-cycle, high-retention contracts with government counterparties. This is the opposite risk profile from a consumer tech name facing discretionary spending cuts.
The Price and Flow Dynamic in War Conditions
PLTR exhibits a distinctive pattern around geopolitical escalation events: outsized single-day moves on contract headlines or conflict escalation news that would not move a pure software peer.
This is because the market is simultaneously pricing two things. PLTR as an AI software company, sensitive to rate conditions like NVDA. And PLTR as a defense infrastructure company, a beneficiary of elevated defense spending that war events accelerate.
The Iran conflict is particularly relevant because Palantir's government AI tools are directly applicable to the intelligence and logistics requirements of a Hormuz-area conflict. Whether or not PLTR wins specific Iran-related contracts is almost secondary. The market prices the optionality of defense AI demand increases when conflict intensity rises.
PLTR vs Pure Software AI Peers
The key distinction is straightforward. In a risk-off macro environment where yields are elevated and growth is slowing, pure software AI names lose their growth multiple alongside NVDA.
PLTR partially offsets this pressure because the defense revenue stream is counter-cyclical to the macroeconomic pressure. Government clients do not reduce AI spending because the Fed is on hold. If anything, geopolitical escalation increases the urgency of defense AI investment.
PLTR has high AI exposure as its core product. Defense and government revenue is approximately 50 percent. Rate sensitivity is medium because government contracts offset the pressure. War tape behavior shows positive divergence.
SNOW has high AI exposure as data infrastructure. Defense and government revenue is minimal. Rate sensitivity is high as a pure growth multiple. War tape behavior shows selling with NVDA.
PATH has medium AI exposure through automation. Defense and government revenue is a small segment. Rate sensitivity is high with small and medium business cyclical exposure. War tape behavior shows selling with macro.
MSFT has very high AI exposure through Azure AI. Defense and government revenue is significant. Rate sensitivity is medium due to diversified cash flows. War tape behavior shows mild outperformance.
How Traders Are Repositioning the AI Complex
The question entering the week is not whether AI is over. The technology cycle is intact. The question is how to express AI exposure when the macro backdrop makes the pure-play hardware trade more complicated.
ETF and Options Flow Signals
The semiconductor ETFs, SMH and SOXX, underperformed the broader Nasdaq last week. This suggests that within the AI complex, hardware-specific exposure is being trimmed relative to software.
Meanwhile, defense-oriented ETFs, XAR and ITA, showed relative strength. This is consistent with the Iran conflict repricing defense spending expectations upward.
Options market signals are consistent with this rotation narrative. Elevated put buying on SMH indicates hedging of semiconductor downside. Call activity in defense names suggests positioning for continued strength.
The options skew—the premium of puts over calls for similar strike distances—widened for high-multiple AI hardware names. This indicates that institutional hedging demand for downside protection increased materially on the week.
The Three Rotation Paths
Observing fund flow patterns and price action, three distinct repositioning behaviors are visible in the current AI complex.
Rotation Type A: Trimming Crowded AI Hardware
This involves reducing NVDA-centric positions that became oversized during the 2024 to 2025 AI momentum phase. The evidence includes NVDA underperforming the SOX index, elevated put buying on SMH, and large-cap tech weight reduction in flow data.
Rotation Type B: Adding Defense-AI Hybrids
This involves rotating into names where AI exposure comes with government contract protection. The evidence includes PLTR outperforming pure software peers on Iran escalation days and inflows into defense ETFs XAR and ITA.
Rotation Type C: Rotating to Picks and Shovels With Cash Flow
This involves preferring AI infrastructure names with current cash generation over pure growth stories. The evidence shows Microsoft, Oracle, and IBM with relative outperformance versus high-multiple loss-making AI names.
None of these rotations implies an end to the AI investment cycle. They imply a maturation of how the market prices AI exposure. The market is moving from a rising tide phase where all AI names rally together, toward a more discriminating phase where the macro environment forces differentiation between AI names with earnings visibility today versus those pricing earnings expected several years out.
The AI trade is not over. It is maturing. In Phase 1, you bought everything with AI in the prospectus. In Phase 2-where we are now-you buy the ones with earnings, government contracts, and cash flows that survive a 4.4 percent 10-year yield.
What Tuesday's CPI Means for the AI Trade
Tuesday's CPI print is the next major catalyst. It will determine whether the current macro configuration intensifies or reverses.
If CPI comes in cool below 0.2 percent month-over-month, rate cut expectations may return. This would relieve pressure on long-duration AI names like NVDA. The entire complex could rally, with pure-play hardware names leading.
If CPI comes in hot above 0.4 percent month-over-month, the stagflation signal intensifies. The Fed remains on hold longer. NVDA faces continued multiple compression. Defense-AI hybrids like PLTR become the preferred expression.
If CPI lands in line near 0.3 percent, the current tension persists. The market remains data-dependent. Differentiation continues.
Tuesday's CPI is as important for NVDA's near-term price action as any earnings report.
Key Takeaways for Traders
One: Iran war plus oil shock is now a co-equal macro input alongside AI fundamentals.
The two-variable trade of AI capex up plus rates down has become a three-variable trade of AI capex up plus rates uncertain plus geopolitical risk premium elevated. Simplistic AI bull theses built on rate cut assumptions need to be stress-tested against the Fed on hold through 2026 scenario.
Two: NVDA remains the AI risk barometer, but its valuation is increasingly a function of the 10-year yield, not just earnings beats.
At $1,100 spot against $1,250 to $1,400 street targets, the upside is real. But it requires either the Fed to cut, clearing the rate overhang, or NVDA to beat estimates by enough to justify the current multiple at elevated yields.
Three: PLTR and defense-AI hybrids may become the preferred way to express AI exposure if the Iran conflict drags on and defense spending expectations continue to rise.
The government revenue mix provides a natural hedge against the macro conditions—high rates, weak consumer—that pressure pure-play AI hardware multiples. The trade-off is lower upside in a pure risk-on AI rally, but meaningfully better drawdown protection in a stagflation scenario.
Four: Tuesday's CPI print is the next major input.
A cool print below 0.2 percent could restore rate-cut expectations and lift the entire AI complex. A hot print above 0.4 percent locks in the higher-for-longer regime and accelerates rotation out of crowded hardware names.
The Bottom Line
The AI trade is not broken. It is evolving.
For months, the setup was simple: AI capex rising, Fed cutting, buy everything with GPU exposure. That simplicity is gone.
In its place is a more complicated environment where macro inputs-oil, yields, the dollar, geopolitics-matter as much as the technology cycle.
NVDA remains the benchmark. Its business has never been stronger. But its stock price is now a function of the 10-year yield as much as its earnings.
PLTR offers a different path. Defense revenue provides insulation from the macro pressures that squeeze pure software multiples. In a war tape, that insulation has value.
The technology cycle continues. The macro environment has changed. The AI trade is maturing.
Phase 2 requires more discrimination than Phase 1. That is not a warning to exit. It is a framework for navigating what comes next.
Disclaimer
This Market Intelligence Brief is published by BreakoutBulletin for educational and informational purposes only. It does not constitute financial, investment, or trading advice.
References to specific securities including NVDA, PLTR, SNOW, PATH, and MSFT are for educational analysis only and do not represent buy or sell recommendations. All data points, price levels, yield levels, and positioning commentary are estimates based on publicly available information as of the publication date and may not reflect current market conditions.
Past performance of any security, indicator, or strategy does not guarantee future results. Trading equities, options, and other financial instruments involves substantial risk of loss.
Always conduct your own independent research and consult a licensed financial advisor before making any investment decisions. BreakoutBulletin is an educational content platform and is not a registered investment advisor or broker-dealer.
© 2026 BreakoutBulletin | breakoutbulletin.com | All rights reserved.