
Every concept covered in this structure series – higher highs, higher lows, lower highs, lower lows, ranges, breakouts – depends on one foundational skill: the ability to correctly identify swing highs and swing lows on a chart. Without this, every structural label you apply is built on a shaky base.
Yet swing point identification is rarely taught with precision. Most educational content shows a clean, textbook chart where the swings are obvious, then leaves traders to figure out for themselves how to apply the concept to messy, real-world price action. The result is inconsistency – different traders marking entirely different points as "the" swing high or swing low on the same chart, and then wondering why their structural reads conflict.
This post fixes that. It covers what swing high vs swing low definition actually means, the criteria for identifying them correctly, how timeframe selection affects which swings are relevant, and the practical mistakes that lead to structural misreads. This is the foundational post in the BreakoutBulletin structure series – the skill that makes posts on higher highs and higher lows, lower highs and lower lows, and range-bound structure actually usable on live charts. Think of these as the price action building blocks for everything that follows.
Disclosure: Nothing on this page constitutes a recommendation to take any position in any security.
What Is a Swing High?
A swing high is a price peak that is flanked on both sides by lower highs. It represents a local maximum – a point where price rose, stalled, and then pulled back. The key word is local: a swing high is not necessarily the highest price in a chart's history. It is simply a point that is higher than the prices immediately surrounding it.
Structurally, a swing high marks a moment where upside momentum was exhausted – at least temporarily. Enough participants were willing to reduce exposure or initiate positions on the other side at that level to halt and reverse the advance.
The Minimum Criterion
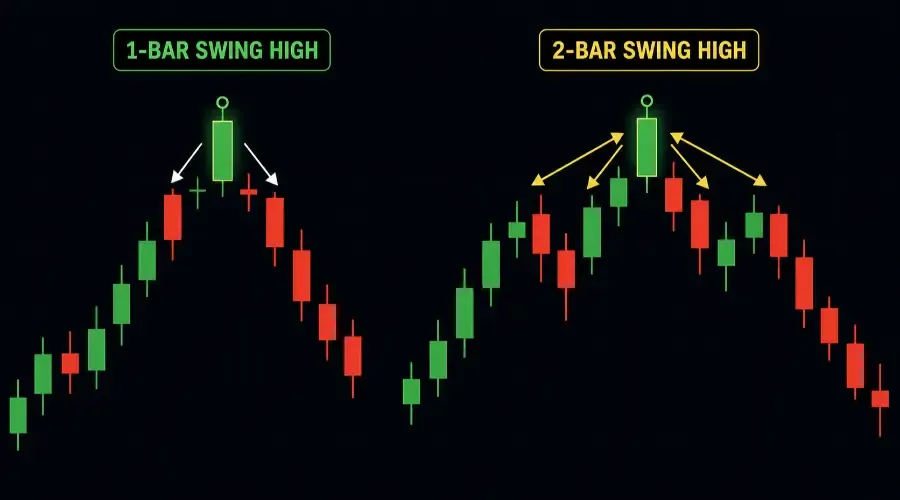
The most basic definition of a swing high requires at least one lower high on each side. A candle that is higher than the candle immediately to its left and the candle immediately to its right qualifies as a one-bar swing high.
However, most traders use a stricter definition in practice:
- Two-bar rule: The swing high candle must be higher than the two candles on each side – four surrounding candles total.
- Three-bar rule: The swing high candle must be higher than the three candles on each side – six surrounding candles total.
The more bars required on each side, the fewer swing highs you will identify, and the more significant each one will be. Fewer but more meaningful swings produce cleaner structural reads. More swings produce more detail but also more noise.
There is no universally "correct" number. The right choice depends on your timeframe and analytical purpose. Here's a practical guideline you can start with:
For most daily chart structural analysis, two-bar swing points (higher than the two candles on each side) offer a good balance between noise reduction and responsiveness.
For weekly charts, one-bar is often sufficient because the timeframe already filters out intraday noise.
For intraday charts (15-min, 1-hour), three-bar may be too conservative – test what works for your instrument; many intraday traders use two-bar.
The table at the end of this post summarizes the trade-offs.
[CHART: A candlestick chart showing a one-bar swing high (single bar higher than immediate neighbors) and a two-bar swing high (bar higher than two bars on each side), labeled accordingly.]
What Is a Swing Low?
A swing low is the mirror image: a price trough that is flanked on both sides by higher lows. It represents a local minimum – a point where price fell, stabilized, and then bounced back. It marks a moment where downside momentum was absorbed – at least temporarily – by participants willing to step in at that price level.
The same bar rules apply:
- One-bar swing low: Lower than both adjacent candles
- Two-bar swing low: Lower than the two candles on each side
- Three-bar swing low: Lower than the three candles on each side
The same trade-off applies: stricter criteria = fewer, more significant swing lows. Looser criteria = more swing lows with more noise.
Why Swing Points Matter
Swing highs and swing lows are not abstract technical concepts. They are the reference points that give structure to price movement. Without them, a chart is just a continuous line with no meaningful landmarks.
Here's what swing points make possible:
- Trend identification: To determine whether a market is making higher highs and higher lows (uptrend) or lower highs and lower lows (downtrend), you first need to know where the highs and lows actually are. Swing points are those reference levels.
- Support and resistance mapping: Major swing lows often become support levels – areas where price has previously found demand and may again. Major swing highs become resistance levels. Every horizontal support and resistance line on a chart is, at its origin, a swing point.
- Range boundaries: As covered in the range-bound trading strategy post, the upper and lower boundaries of a range are defined by clusters of swing highs and swing lows at approximately the same level.
- Structural breaks: A break of structure – when a prior swing low is violated in an uptrend, or a prior swing high is exceeded in a downtrend – can only be identified if you know where those swing points are.
In short: market structure swing points are not one tool among many. They are the prerequisite for every other structural tool.
The Role of Timeframe
This is where many traders go wrong. They identify swing points on one timeframe without considering whether those swings are meaningful at the scale of their analysis.
Here's the core principle: the relevant swing points are the ones visible on the timeframe you are analyzing.
A swing high on a 5-minute chart is a local maximum in a 5-minute context. It may not even be visible as a distinct point on a 1-hour chart – it could be just one of dozens of minor fluctuations within a single hourly candle. Conversely, a swing high on a weekly chart represents a multi-week peak that encompasses hundreds of intraday swings. This fractal nature is why you need to be disciplined.
Practical Timeframe Guidelines
For daily chart structural analysis: Use daily swing points. Identify peaks and troughs that are clearly visible on the daily chart, without zooming into intraday movement to refine them.
For weekly chart structural analysis: Use weekly swing points. A weekly swing high is a week where the high exceeded the highs of the surrounding weeks. This filters out all intraday and daily noise and shows the large-scale structure.
For intraday analysis: Use intraday swing points on the timeframe you are working with – 15-minute, 1-hour, etc. Recognize that these swings are subordinate to the structure on higher timeframes.
The key discipline: Once you choose a timeframe for structural analysis, stay on it. Do not zoom in to justify a swing point that is not visible at your primary timeframe, and do not import higher-timeframe swings into a lower-timeframe analysis without explicitly acknowledging the shift in scale.
Significant vs. Minor Swing Points
Not all swing points carry equal weight. Within any timeframe, some swings are structurally significant – they represent major turning points – while others are minor fluctuations within a larger move. Understanding significant vs minor swing points is what separates a clean structural map from a cluttered mess.
What Makes a Swing Point Significant?
- Magnitude of the move: A swing high followed by a deep, sustained decline is more significant than one followed by a shallow, brief dip. The subsequent move reveals how much conviction was behind the reversal at that point. A quick rule of thumb: if the subsequent move from a swing high retraces less than 20% of the prior advance, that swing is likely minor. If it retraces more than half (50%+), it is significant.
- Volume at the swing: A swing high that forms on notably elevated volume suggests stronger participation at that level – more participants made a decision there, which makes it a more meaningful reference going forward. A "blow-off" top – a swing high accompanied by a massive volume spike – often marks a major exhaustion point, making that specific level a very high-probability resistance zone for the future.
- How cleanly it is respected: If price returns to the level of a prior swing high multiple times and consistently reacts there – either stalling, reversing, or pausing – that swing point is structurally significant. If price slices through it without hesitation on subsequent tests, it was likely minor.
- Position within the larger structure: A swing high that forms at the top of a multi-month trend is more significant than one that forms during a two-day bounce within that trend. Context determines significance.
Labeling Convention
A practical approach used by many structured traders is to label swing points by their structural role:
- Major swing high / Major swing low: Defines the primary trend direction on the relevant timeframe. These are the points used to determine HH/HL or LH/LL sequences.
- Minor swing high / Minor swing low: Smaller fluctuations within the larger move. Useful for intraday or shorter-term context but not the primary reference for trend identification.
Using this two-tier labeling prevents the common error of treating every minor wiggle as a structural event.
Swing Points in Real Market Conditions
Textbook examples always show clean, well-separated swings with obvious peaks and troughs. Real charts are messier. Here's how to handle the common complications:
Multiple Candles at the Same Level
Sometimes a swing high does not have a single peak candle – instead, price reaches a level and then grinds sideways for several candles before pulling back. In this case, the swing high is the zone where price peaked, not a single bar. Mark it as a small resistance zone rather than a precise point.
Overlapping Swings
In choppy, low-momentum markets, swings overlap significantly – the pullback from one swing high retraces deeply into the prior advance, and the next rally barely exceeds the last high before failing again. This overlap is itself structurally informative: it suggests the market is transitioning from a clear trend into a range.
Long Wicks vs. Candle Bodies
A candle with a very long upper wick creates ambiguity – the wick represents a price that was reached intraday but rejected before the close. Whether to mark the swing high at the wick high or the candle body high depends on your analytical purpose. For marking support and resistance zones, wicks matter – price did reach that level. For trend identification using HH/HL or LH/LL sequences, many professional traders use closing prices to reduce noise from intraday spikes.
If you want a single default rule: use candle bodies for trend identification, use wicks for support/resistance levels. Apply it consistently.
Common Pitfall: The Look-Ahead Bias
One mistake beginners make is trying to label a swing point before it's actually confirmed. A candle is only a swing high after the bars on both sides have closed. You cannot label a live, still-forming candle as a swing high. Wait for the flanking bars to finish. Otherwise you'll constantly redraw your structure as new price comes in.
Connecting Swing Points to the Full Structure Framework
Once you can identify swing highs and swing lows correctly and consistently, the rest of the structure series flows directly from that skill:
- Plot your swing points on the chart
- Compare successive highs: Are they higher (HH), lower (LH), or roughly equal?
- Compare successive lows: Are they higher (HL), lower (LL), or roughly equal?
- Read the sequence: HH + HL = uptrend. LH + LL = downtrend. Equal highs + equal lows = range.
- Watch for breaks: When a significant swing low is violated in an uptrend, or a swing high is exceeded in a downtrend, that is a structural event. The Break of Structure vs. Change of Character post covers what that means and how to interpret it.
This is the complete workflow. Swing point identification is step one. Everything else follows.
Choosing Your Bar-Count Rule: A Quick Reference
| Rule | # Surrounding Bars | Typical Use Case | Trade-Off |
|---|---|---|---|
| One-bar | 2 (left & right) | Weekly charts, very fast intraday | Many swings, more noise |
| Two-bar | 4 (two left, two right) | Daily charts, balanced analysis | Good balance of significance and detail |
| Three-bar | 6 (three left, three right) | Very clean structure, longer-term daily | Fewer swings, may miss some turns |
Most traders using daily charts for positional analysis find the two-bar rule to be the most practical starting point.
The Full Structure Cluster
| Article | What It Covers |
|---|---|
| Higher highs and higher lows: market structure guide | Uptrend structure – HH and HL |
| Lower highs and lower lows: bearish structure explained | Downtrend structure – LH and LL |
| Range-bound trading strategy | Sideways structure – ranges, support, resistance |
| This post | Swing highs and swing lows – the foundational building blocks |
| Break of structure vs. change of character | How structural transitions are identified |
| Higher highs vs. equal highs: trend or fakeout? | Reading equal levels within trends |
Frequently Asked Questions (FAQ)
Q: What is the "Two-Bar Rule" for swing points?
A: The two-bar rule is a technical filter where a swing high must be higher than the two candles to its left and the two candles to its right. Similarly, a swing low must be lower than the two candles on either side. This filters out minor price "noise" and identifies more significant turning points.
Q: Should I use candle wicks or bodies to mark swing points?
A: It depends on your goal. A common professional standard is to use candle bodies for trend identification (HH/HL) to avoid being misled by intraday spikes, and use candle wicks for mapping support and resistance zones, as the wick represents the absolute price reached.
Q: How do I tell if a swing point is "significant" or just minor?
A: A significant swing point is usually followed by a deep move (re-tracing 50% or more of the prior move), occurs on elevated volume, or is respected multiple times by price action later on. Minor swing points are small fluctuations within a larger, one-directional move.
Q: Why do my swing points look different on different timeframes?
A: Market structure is fractal. A swing high on a 15-minute chart might be just one small part of a single candle on a Daily chart. You should always identify and use swing points that are clearly visible on the specific timeframe you are currently analyzing.
Summary
Swing highs and swing lows are the atomic units of market structure. Every structural concept – trend direction, range boundaries, breakouts, structural breaks – is built from these reference points. Here is the framework condensed:
- A swing high is a peak flanked by lower highs on both sides; a swing low is a trough flanked by higher lows on both sides
- The strictness of the definition (one-bar, two-bar, three-bar) determines how many swings you identify and how significant each one is. For daily charts, two-bar is a strong default.
- Timeframe determines relevance: only use swing points visible on the timeframe you are analyzing
- Not all swing points are equal – significance is determined by magnitude (rule of thumb: >50% retrace = significant), volume, subsequent respect, and position within larger structure
- In messy real-world conditions, treat ambiguous peaks and troughs as zones, not precise points, and apply your approach consistently
- For wicks vs. bodies: use candle bodies for trend identification, use wicks for support/resistance levels
- Avoid look-ahead bias: a swing point is only confirmed after the flanking bars have closed
- Once swing points are correctly identified, trend direction (HH/HL, LH/LL) and range structure (equal highs/lows) can be read directly from comparing successive points
Master swing point identification and you have the one skill that makes all other structural analysis coherent.
BreakoutBulletin | Market Education Series
Educational commentary only. Not investment advice. Past performance does not guarantee future results.