
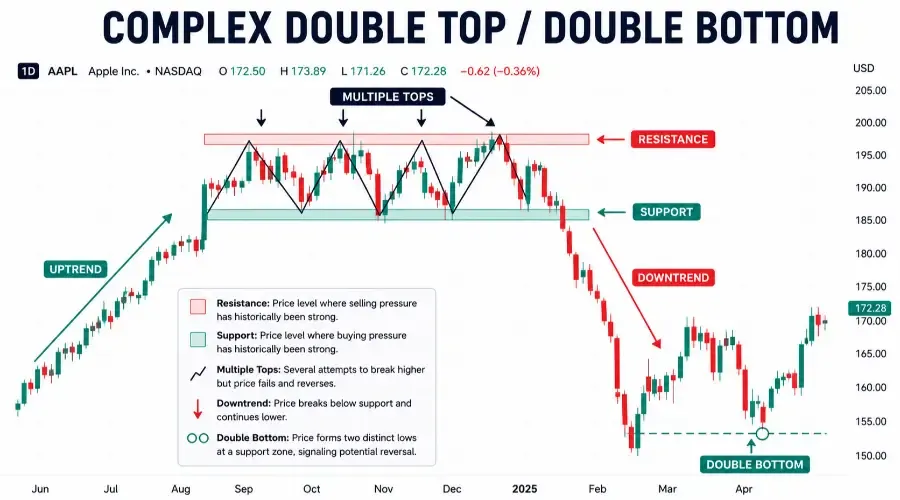
Support and resistance lines form the foundation of almost every technical trading decision. Entry anchors, hard stop levels, profit targets, pattern invalidations–all of them map directly to price levels that the market has previously treated as significant macro memory.
Getting those levels right is the critical line between a well-constructed risk profile and a guess dressed up as analysis.
Chart patterns build on that exact same foundation. A bull flag, a cup-and-handle, or a head-and-shoulders layout is defined by precise structural rules involving price tracking, trend context, and historical volume behaviors. A pattern that looks right visually but fails its core structural criteria is a mirage–it is an empty shape on a chart that doesn't carry genuine analytical weight.
While a Large Language Model (LLM) cannot physically draw lines on your interactive screen, it can do something much more useful: it can act as an emotionless logic filter. By feeding text-based technical parameters to a model, you can systematically audit whether what you are seeing visually actually adheres to structural constraints. This guide covers how to establish that definitive verification layer.
Pattern validation is the fourth of five technical analysis tasks in this hub. Technical Analysis with AI covers the full hub overview and the two roles AI plays in technical work—pattern interpretation and multi-factor confirmation.
Describing a pattern or level to AI requires knowing how to format the underlying price data alongside the text description. What to Paste into AI for Chart Analysis covers the four input types and the template that combines them effectively.
How to Map Stock Support and Resistance for AI Workflows
The main hurdle in using AI for level analysis is translation–converting visual chart data into structured text that an LLM can parse. An expert-level description requires breaking a price zone down into five distinct technical components:
The Exact Price Point:
State a specific numerical level, not a wide range. "Support at $221.40" gives the AI an exact mathematical coordinate to reference.
The Primary Source:
Define what anchor created the level. Is it a prior major swing high, an old swing low, a high-volume node, or a dynamic moving average?
The Test History:
Quantify how many times the market has interacted with this level and across what dates.
Multi-Timeframe Confluence:
Note if the level appears on higher-tier timeframes. A daily support zone that directly aligns with a major structural level on a weekly chart carries vastly superior structural weight.
The Volume Profile Context:
Document whether volume expanded or contracted during past tests. Above-average volume at a support test demonstrates heavy structural demand.
Sample Data Format to Paste Into Your Prompt
"Support at $221.40 – This level corresponds directly with the prior swing low from September 14th on the Daily chart and shows strong multi-timeframe confluence with the 20-week EMA. Price has tested this specific zone three times (Sept 14, Oct 2, and the current pullback). Volume on the first two touches was 25% above the 20-day moving average, proving active institutional buying. The current third touch is occurring on low, below-average volume."
Setting the Audit Framework: The Significance Prompt
Not every visual bounce is a major turning point. Many lines traders draw are coincidental noise. This structured script forces your chart pattern validation AI to prune low-probability zones and isolate key structural lines.
System Role: Act as an objective, institutional risk manager validating key price zones. Your task is to evaluate the technical significance of the described levels based purely on structural evidence. Treat this output as a well-informed second opinion to challenge human visual bias.
Audit Guidelines:
- Rank the provided levels from highest to lowest structural significance based entirely on historical test frequency, volume confirmation, and multi-timeframe alignment.
- Flag any levels that appear purely coincidental or lack sufficient historical volume validation to be trusted.
- Detail the exact volume behavior required on the current session's test to prove that major market participants are actively defending this line.
Execution Constraint: Do not assume or predict future directional outcomes. Act as a neutral logic engine providing a technical sanity check.
Chart Pattern Validation: Describing Setups for AI Analysis
To evaluate a chart structure, you must explicitly document its geometric components. Naming a pattern is meaningless to an AI; describing its proportions is everything. Here are the exact structural variables you need to feed into your model for common technical chart patterns:
The Bull Flag
The Flagpole:
A sharp, rapid, directional price thrust upward on expanding, above-average volume.
The Flag Channel:
A tight, parallel consolidation channel sloping slightly downward or moving sideways immediately following the flagpole apex.
Volume Drift:
Volume must steadily contract throughout the flag formation, signaling a clean lack of distribution.
Duration:
Typically ranges between 5 to 15 sessions on a daily tracking chart.
The Cup-and-Handle
The Left Rim Base:
An established, mature uptrend followed by a smooth, rounded U-shaped correction and subsequent stabilization.
The Depth Metric:
The absolute drop from the left rim peak to the bottom of the cup (typically bounded between 12% to 35%).
The Handle Structure:
A shallow, brief consolidation or slight downward drift inside the upper third of the total cup depth, lasting 5 to 15 trading days.
Volume Behavior:
Deep volume contraction through the base of the cup, with an expected explosive expansion on the final handle breakout.
The Head-and-Shoulders
The Lateral Shoulders:
Two distinct price peaks of roughly symmetrical height and duration flanking a central, higher peak.
The Central Head:
A sharp upward extension setting a higher peak than either shoulder, followed by a pullback down to the baseline.
The Neckline Anchor:
The horizontal or slightly sloped line connecting the major structural pullback lows on both sides of the head.
The Volume Decelerator:
Clear volume divergence: volume should peak heavily on the left shoulder and consistently diminish through the head and the right shoulder formation.
Pattern logic validation is most useful when combined with momentum indicator context. How to Use AI to Interpret RSI, MACD, and Momentum Indicators covers how to add the indicator layer and how to ask AI to reconcile what the pattern suggests with what the momentum is saying.
Protecting Against the Invalidation Stop Run
Every valid technical pattern contains an explicit line in the sand where the underlying logic fails. A core danger for retail traders is over-reacting to intra-session volatility spikes–frequently referred to as a trading stop run strategy or liquidity sweep–where the price temporarily pierces a key level before sharply reversing back into the pattern.
To protect against fakeouts, your invalidation strategy must focus heavily on a decisive closing basis (the end-of-session daily close) rather than simple intra-session tail breaches.
The Invalidation Prompt Rule
When prompting the AI to locate your risk parameters, use this exact syntax rule:
text
"Identify the precise structural invalidation level for this pattern. Explicitly state why a breach requires a decisive close on a daily closing basis rather than an intraday wick violation, and explain the structural changes that occur if that level is cleanly broken."
Technical Analysis AI: Q&A Section
Q: Can I run this logic check by simply uploading a visual chart screenshot to an AI?
A: While modern vision models are effective at spotting macro trends, they cannot precisely calculate historical volume deviations, calculate exact handle depth percentages, or track subtle multi-timeframe interactions. Translating visual cues into hard text parameters prevents the model from hallucinating technical values.
Q: Why does the AI sometimes call my pattern something completely different?
A: Chart definitions carry an inherent degree of subjectivity across different trading systems (such as variations in accepted cup depths or flag durations). An LLM operates primarily on strict, textbook definition baselines. If your setup stretches common boundaries, the AI will correctly classify it based on its rigid geometric rules (e.g., a wide rectangle instead of a tight flag), which helps keep your analysis grounded.
Q: How do I speed up the text formatting process for these prompts?
A: For your first few runs, manually extracting the data and formatting the data block will take 20 to 30 minutes as you train your eye to see the structural inputs. However, the process speeds up dramatically with practice. You can easily fast-track this workflow by saving your structural prompts as reusable templates or copying direct OHLCV text tables out of your charting software.
Q: Should I treat the AI's pattern validation as a definitive buy or sell signal?
A: Absolutely not. An LLM's assessment is entirely dependent on its training data and the specific framing of your prompt. It does not predict outcomes–even perfect patterns fail a significant percentage of the time due to broader market dynamics. Treat the AI as a highly analytical, objective second opinion designed to flag structural blind spots and challenge your assumptions.
The Workflow Summary
Integrating a structured technical audit into your routine filters out low-probability trades before capital is ever exposed to risk. Here’s how each phase maps to the AI’s role and the value you get back:
| Phase in the Routine | Trader Data Input | AI Analytical Function | Expected Output Value |
|---|---|---|---|
| Structural Mapping | Precise price levels, multi-timeframe points, test history. | Filters out random market noise and coincidental price wicks. | A refined, verified list of high-integrity support and resistance zones. |
| Pattern Geometry Audit | Flagpole, channel, or cup depth metrics and volume trends. | Tests structure against rigid textbook definitional requirements. | Correction of visual misclassifications (e.g., catching an over-extended flag). |
| Risk Architecture | Nearby support anchors and daily session bounds. | Identifies invalidation levels based on clean structural logic. | Eliminates emotional stop placement; insulates against intraday stop runs. |