
Macro Frameworks
By Manish T. · BreakoutBulletin
Every few weeks, the U.S. Treasury sells tens of billions of dollars of new government debt at auction, and every few weeks the market reads the result through a single number: bid-to-cover. If the auction "clears," the headline says demand was fine and everyone moves on.
That reflex misses the more important question. An auction always clears–the price simply adjusts until someone absorbs the supply. What matters is who that someone is, and how much they had to be paid to take it. In a period when the government is borrowing heavily and corporations are issuing record amounts of debt at the same time, the composition of demand, not the headline clearing, is where the real signal lives.
What a Treasury Auction Actually Is
Start with the mechanics. The Treasury announces a fixed amount of a security to sell–say, $42 billion of 10-year notes. Buyers submit bids, and the auction clears at the single yield high enough to place all of the bonds.
The most-watched summary statistic is the bid-to-cover ratio, which divides total bids received by the amount offered. Historically, for 10-year notes, it runs around 2.45x to 2.56x–roughly two and a half dollars of bids for every dollar of debt on offer. A number near that average gets read as "healthy," and the market moves on.
But bid-to-cover is a sum, and a sum hides its parts. It tells you how much demand showed up. It does not tell you what kind, and the kind is what matters.
The Three Buyers Who Split Every Auction
Every auction is awarded across three groups, and the split is the story.
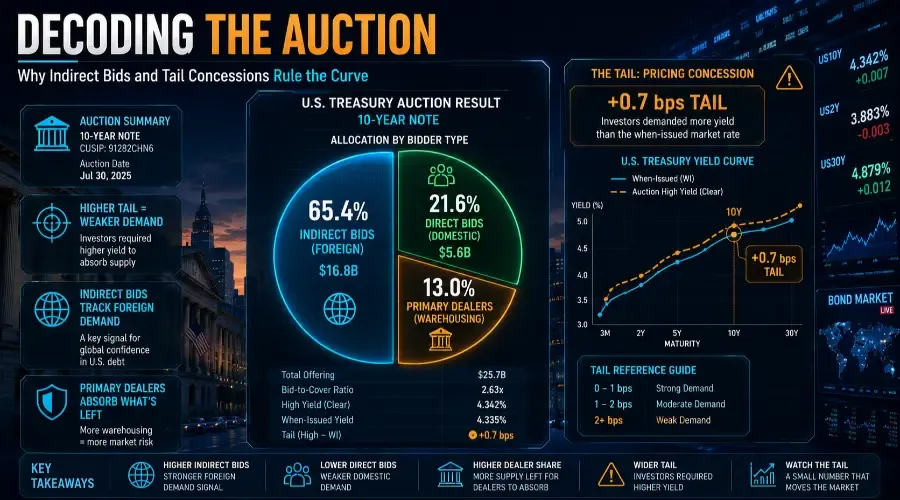
Indirect bidders are primarily foreign central banks and overseas institutional investors bidding through intermediaries. They are the price-insensitive, long-term holders that governments most want to see–they buy and hold rather than trade.
Direct bidders are domestic institutions–money managers, pension funds, hedge funds–bidding for their own account.
Primary dealers are the 24 large banks with a direct market-making obligation to the Federal Reserve and Treasury. They are obligated to bid at every auction. Their allocation share is a residual: they absorb whatever indirect and direct bidders don't take.
When indirect demand is strong, it means real-money, long-term investors are willingly absorbing the new supply. When indirect demand fades and dealers are left taking down a larger-than-usual share, the auction still clears, but the bonds are being warehoused by intermediaries who did not especially want them and will look to sell them back into the market. Same clearing headline, very different meaning underneath.
Two Tells Reveal the Real Story
Two metrics reveal which kind of auction just happened.
The first is the tail. The when-issued market–where the security trades before the auction, reflecting real-time investor demand and expectations–sets an expected yield. If the auction clears at a higher yield than that (a tail), real-money demand came in soft and buyers demanded a concession. If it clears lower (a stop-through), demand was strong.
The second, and cleaner, tell is the indirect bid percentage. Historically, the indirect-bidder share for 10-year auctions has ranged between 55% and 70%. A sudden drop from that range is one of the most reliable signals of softening foreign demand, well before it shows up anywhere else.
Neither number appears in the one-line "auction cleared" summary, yet both are public within minutes of the result on TreasuryDirect. Reading them is the difference between knowing an auction happened and knowing what it meant.
Case Study: Two Auctions, Two Signals
The difference between a strong auction and a weak one is not theoretical. Here are two real-world examples from June 2026.
Strong Auction: June 16, 2026 – 20-Year Bonds
The Treasury sold $13 billion in 20-year bonds at a high yield of 4.927%. The auction had a negative tail of 1.0 basis point–clearing below the when-issued yield of 4.937%. The bid-to-cover ratio was 2.75, above the recent average of ~2.65.
Most importantly, indirect bidders took down 73.2% of the auction–a significant jump from the recent average of 64.9%. Domestic direct bidders accounted for just 19.9%, below their typical 24.3% share, and primary dealers were left with only 8.5%.
Market read: Foreign demand was strong; dealers had little to warehouse. This was a clean, well-absorbed auction. Market observers graded it roughly an A-minus, with the only blemish being lighter domestic participation.
Weak Auction: June 24, 2026 – 5-Year Notes
The Treasury sold $70 billion in 5-year notes at a yield of 4.200%–the highest level since January. The auction tailed by 0.7 basis points, clearing above the when-issued yield of 4.182%. The bid-to-cover of 2.35 was near average, but the composition told a different story.
Indirect bidders fell 13.3 percentage points to 61.6%–the lowest level since January. Direct bidders rose to 25.5%, and primary dealers were left with 12.9%.
Market read: Foreign demand softened meaningfully; dealers absorbed more supply than in the prior month. The auction was graded C- with the tail and composition both flashing caution.
The contrast is instructive. Both auctions cleared. Both had bid-to-cover ratios near historical averages. But one signaled strong foreign demand and a well-placed auction; the other signaled softening international appetite and a market where dealers were left holding more supply. The headline numbers alone would have told you nothing.
Why the Composition Matters Right Now
This mechanic matters more in some periods than others, and this is one of the more demanding ones. The government is in a heavy-issuance cycle: the quarterly refunding has been running around $125 billion, split roughly $58 billion of 3-year notes, $42 billion of 10-year notes, and $25 billion of 30-year bonds, alongside record reliance on short-term bills.
All of that supply has to find a home. And it is competing for the same finite pool of duration buyers as a record wave of corporate bond issuance from hyperscalers financing the AI build-out. When government and corporate supply surge together, the marginal buyer of duration becomes more expensive, and the composition of each auction becomes the place that pressure shows up first.
The Quiet Second-Order Effect
Here is why a merely "adequate" auction can matter weeks later. If dealers are absorbing more supply than usual, the cost of distributing that duration does not vanish; it tends to reappear as a higher term premium–the extra yield investors demand to hold long-dated bonds beyond what short-term rate expectations would imply.
A rising term premium lifts long-end yields for reasons that have nothing to do with the Federal Reserve, and higher long-end yields feed straight into the rest of the market: they raise the discount rate on equities, pressure rate-sensitive sectors, and change the math on corporate refinancing and buybacks.
That is the reflexive part. A buyer mix that looks slightly softer today can leak into stock valuations and credit spreads later, without ever producing the dramatic "failed auction" headline that most people are waiting for. The stress hides in the distribution, not the clearing.
How to Read the Next Auction in Real Time
You can track all of this yourself; the results are published within minutes on TreasuryDirect. Five things tell you what an auction really did.
| Signal | What to Watch | Threshold |
|---|---|---|
| Bid-to-cover | Is it drifting below the trend for that maturity? | Strong: Above 6-month avg; Weak: Below 6-month avg |
| Indirect bid % | The cleanest early sign of softer foreign demand | Strong: >65-70%; Neutral: 55-65%; Weak: <55% |
| Primary-dealer takedown | Larger share = supply being warehoused | Strong: <10%; Neutral: 10-15%; Weak: >15-20% |
| Tail (or stop-through) | Clearing above when-issued = demand shortfall | Strong: Stop-through; Neutral: 0-1bp; Weak: >2-3bp |
| Term premium | Aggregate confirmation–is it grinding higher? | Rising across supply-heavy stretch = buyer base straining |