
Trading a momentum strategy in a contraction regime is not the same as trading it in an expansion regime. The same setup that generates consistent returns in a growth-driven bull market can produce consistent losses when the macro environment has shifted against it. The strategy didn't break. The regime did.
Macro regime identification is the process of classifying the current economic environment on the axes that matter most for positioning – growth versus contraction, inflation versus deflation – and adjusting sector exposure accordingly. AI processes the relevant data efficiently and produces a structured regime assessment. This post covers exactly how.
Macro regime identification is the third strategy-specific application in the Strategy-Specific Applications with AI hub. It gives the full overview and covers why knowing the current regime changes how you apply every other analytical framework.
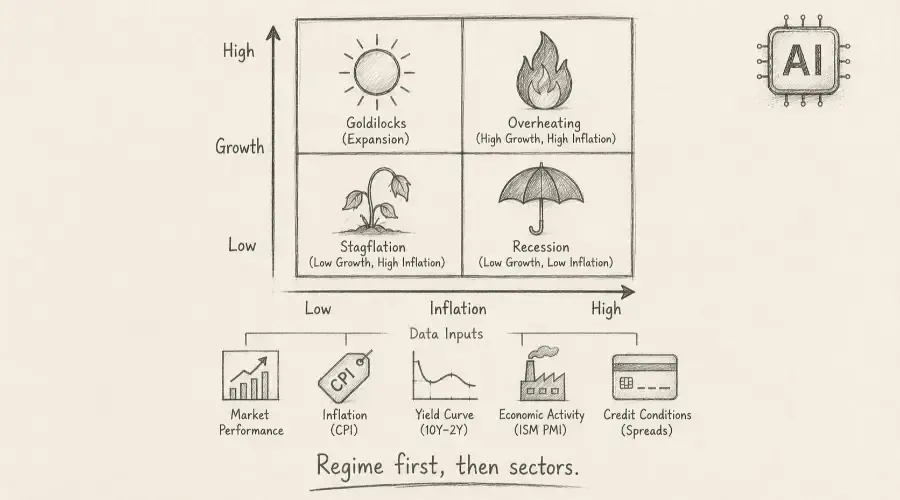
The Four Regime Quadrants
Economic regime classification sits on two axes: growth direction and inflation level. The intersection produces four quadrants, each with distinct sector implications.
| Regime | Growth | Inflation | Favoured Sectors | Avoid |
|---|---|---|---|---|
| Goldilocks | Expanding | Low/Falling | Technology, Consumer Discretionary, Growth | Defensives |
| Inflationary Boom | Expanding | High/Rising | Energy, Materials, Industrials, Financials | Long-duration Tech |
| Stagflation | Contracting | High/Rising | Commodities, Energy, TIPS, Cash | Most equities |
| Deflation / Recession | Contracting | Low/Falling | Healthcare, Consumer Staples, Utilities, Bonds | Cyclicals |
This framework is directional, not mechanical. Individual stocks and sectors can exhibit relative strength even within an unfavourable regime – the regime provides the macro tailwind or headwind, not a guarantee of outcome. Always confirm macro positioning against actual price action before sizing a trade.
The Five Data Inputs for Business Cycle Analysis
Five data series carry the highest diagnostic weight for economic regime classification. Each is publicly available – FRED, TradingView, and the Federal Reserve website all provide reliable access.
ISM Manufacturing PMI – above 50 signals expansion; below 50 signals contraction. Turns before GDP data and provides a real-time read on industrial activity. Source: ISM monthly release.
CPI year-over-year – the primary inflation axis input. Above 3% indicates elevated inflation; below 2% indicates low inflation or deflationary pressure. Source: BLS monthly release.
Federal Reserve language is one of the most important signals for regime classification because it influences inflation expectations, interest-rate policy, and financial conditions. How to Interpret Fed Statements and Macro News with AI covers how to extract the rate path signals from FOMC language and how they update the regime assessment.
10-year minus 2-year yield spread – the yield curve configuration. Inverted (below zero) has preceded every US recession in the past 50 years with a 12–18 month typical lead. Steepening signals improving growth expectations. Source: FRED daily.
The yield curve is one of the five key inputs to regime classification and has its own dedicated analytical framework. How to Analyze Yield Curve Moves and Sector Impact Using AI covers how to read the specific curve configuration and translate it into sector positioning decisions that complement the regime assessment.
High-yield credit spreads – the spread between high-yield corporate bonds and comparable Treasuries. Spreads above 400–500 basis points often signal stress; sustained above 800 basis points signals crisis-level conditions. Below 300 basis points indicates benign financial conditions. Source: FRED (ICE BofA US High Yield Index Option-Adjusted Spread).
GDP trend – the direction of real economic growth. One important caveat: GDP is reported quarterly with significant lags. The advance estimate arrives approximately four weeks after quarter-end; revisions follow for months. In real-time, treat GDP as confirmatory rather than leading – ISM PMI and credit spreads will have already reflected the direction before GDP confirms it.
Handling Conflicting Indicators
When indicators point in different directions – PMI below 50 but GDP still positive, or credit spreads tightening while the yield curve remains inverted – weight the forward-looking indicators most heavily. The yield curve and credit spreads are market-based and incorporate expectations; they typically lead GDP and PMI. If the yield curve and credit spreads agree and PMI conflicts, lean toward what the market is pricing. When all indicators conflict genuinely, the prompt should flag the ambiguity explicitly rather than forcing a classification.
Regime Duration and Transition Signals
Regimes are not short-term phenomena. Inflationary periods can persist for years; growth contractions can flip within quarters. Monthly review is appropriate for regime classification, but the risk of monthly updates is being slow to recognise a transition. Watch specifically for threshold crossings – these are the early transition signals:
| Indicator | Contraction → Recovery Signal | Expansion → Late Cycle Signal |
|---|---|---|
| ISM PMI | Crosses above 50 after sustained below | Falls from 55+ toward 52 |
| Yield curve | Re-steepens from inversion toward zero | Flattens below 50 bps |
| Credit spreads | Tighten below 400 bps after elevated | Widen above 350 bps from lows |
| CPI | Drops below 3% YoY | Accelerates above 4% YoY |
When two or more transition signals trigger in the same month, weight that as a regime shift candidate in the prompt.
The Macro Regime Prompt
Act as a macro analyst identifying the current economic regime
for portfolio positioning.

I've provided five data inputs below. Where GDP data is preliminary
or subject to revision, treat it as directional only and weight
PMI and credit spreads more heavily.

Data:
– ISM Manufacturing PMI: [value] (above/below 50)
– CPI YoY: [value]%
– 10Y-2Y Yield Spread: [value] bps (positive/negative)
– High-Yield Credit Spreads: [value] bps
– GDP trend: [positive/negative/flat, note if preliminary estimate]

Based only on the data I've provided:

(1) Classify the current regime using the four quadrants:
    Goldilocks / Inflationary Boom / Stagflation / Deflation-Recession.
    State specifically which data points support the classification.

(2) If indicators conflict, identify which conflict and weight
    forward-looking indicators (yield curve, credit spreads)
    more heavily in reaching the classification. Flag if ambiguity
    remains after weighting.

(3) Identify any threshold crossing in the past month that may
    signal a regime transition – reference the specific indicator
    and direction.

(4) State the sector positioning implied by the current regime –
    which sectors are favoured and which are to be avoided or
    underweighted.

(5) State the appropriate caveat: macro regime provides a directional
    framework. Price action may diverge from the implied regime
    positioning, particularly in individual stocks or subsectors
    with specific catalysts.

Do not introduce external economic data beyond what I've provided.
Mid-2022 Regime Classification – Worked Example
In Q2 2022, the five data inputs produced an unambiguous regime signal:
- ISM PMI: 53 – expansion, but declining
- CPI YoY: 8.6% – significantly elevated
- 10Y-2Y spread: −18 bps – inverted
- High-yield spreads: 590 bps – above the 400–500 stress threshold
- GDP: Q1 2022 negative (−1.6% advance estimate, known by late April)
Regime classification: Stagflation – contracting growth signal (inverted yield curve, above-stress credit spreads, declining PMI) combined with high inflation. The GDP figure was the advance estimate, treated as directional; PMI and credit spreads had already confirmed the direction.
Implied sector positioning: Energy and commodities favoured; long-duration technology and consumer discretionary to be avoided or underweighted. XLE returned approximately +31% in Q2 2022; XLK returned approximately −25%.
Transition signals that followed: ISM PMI crossed back below 50 in June 2022, confirming the contraction signal. Credit spreads widened above 600 bps by July – moving from stress toward crisis-adjacent territory. Both crossings, caught in the monthly update, would have reinforced the defensive positioning ahead of the broader market recognition of the recessionary dynamic.
Building Macro Regime Review Into the Workflow
Run the regime classification monthly – more frequently introduces noise without improving signal quality, given the slow-moving nature of the underlying data. Pair the monthly regime update with the Friday sector rotation review from Blog 31. The regime classification sets the macro framework. The sector rotation ETF data confirms whether the market is reflecting that framework in current performance. When both align, sector positioning conviction is highest. When they diverge, the divergence is itself the most important signal to investigate.
Regime classification produces a directional hypothesis about which sectors should be favoured. How to Run Sector Rotation Analysis with AI covers how to test that hypothesis against actual ETF performance data.
Frequently Asked Questions
Q: What is a macro regime and why does it matter for my trading strategy?
A macro regime is the current state of the economy defined by the intersection of growth direction and inflation level. It matters because different sectors and asset classes perform differently in different conditions. A growth-focused technology strategy that works in a Goldilocks regime – expanding growth, low inflation – can produce consistent losses in a stagflation regime where the same macro conditions actively work against long-duration growth assets. Identifying the regime allows strategy adjustment before market conditions force it.
Q: Can I use AI to predict future economic regimes?
AI should be used as an analytical tool, not a forecast engine. Rather than predicting the next regime, AI excels at classifying the current one from the five data inputs – and at flagging threshold crossings that suggest a transition may be underway. Framing the analysis as "where are we now, and what signals suggest movement" is more reliable than asking for a regime prediction. The current regime classification informs positioning. The transition signals inform when to reassess.
Q: What are the best indicators to watch for regime shifts?
Prioritise forward-looking, market-based indicators over lagging economic reports. The 10-year minus 2-year yield spread and high-yield credit spreads both incorporate market expectations and typically turn before GDP and CPI data confirm the shift. ISM Manufacturing PMI is the highest-frequency leading indicator available monthly. When yield curve, credit spreads, and PMI all cross their key thresholds in the same direction within a one-to-two month window, treat that as a high-confidence regime transition signal rather than noise.