
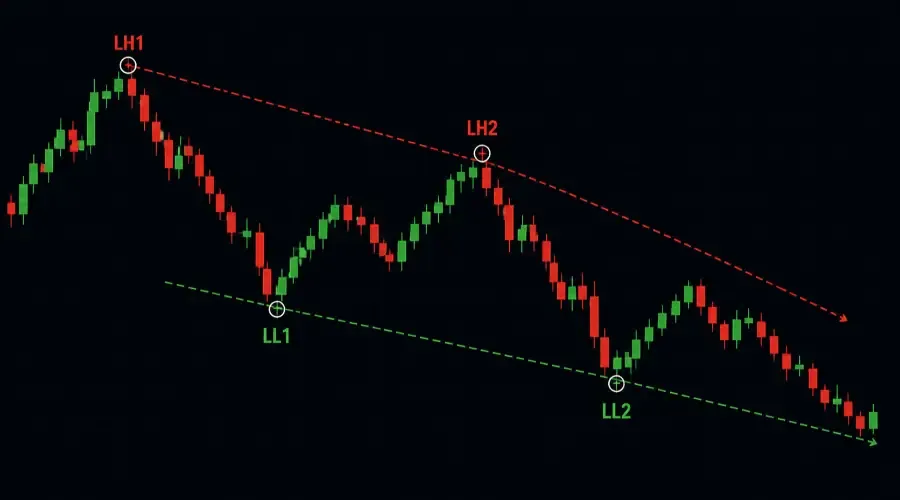
If higher highs and higher lows define an uptrend, then lower highs and lower lows are their mirror image – the structural fingerprint of a downtrend. Most traders spend a disproportionate amount of time studying bullish setups and treat bearish structure as an afterthought. That is a gap worth closing, because markets spend a significant portion of time in decline or distribution phases, and misreading that structure has real consequences for how you interpret price action. Understanding lower highs and lower lows is the key to spotting bearish market structure early, and learning the difference between a downtrend vs. pullback will keep you from getting trapped in false reversals.
This guide covers what lower highs and lower lows are, how to identify them accurately, how to distinguish a true downtrend from a simple pullback, and what the transition from bullish to bearish structure actually looks like on a chart. You’ll learn the identifying lower highs in trading process and spot market structure reversal signals before they become obvious to everyone else.
This post is part of the BreakoutBulletin structure series. If you have not read the foundation post on higher highs and higher lows, start there first – it establishes the swing point framework that this article builds directly on.
Disclosure: Nothing on this page constitutes a recommendation to take any position in any security.
Bearish Structure: The Basic Definition
A downtrend is not just "price going down." It is a specific pattern of declining swing points – each peak lower than the last, and each trough lower than the last. That LH LL sequence price action is what separates a structured decline from random noise.
Lower High (LH)
A lower high occurs when a rally (counter-trend bounce) stalls and reverses at a point below the previous swing high. The market tries to recover, but it cannot reach the level it reached before. This is the first signal that upside momentum is weakening.
Example: The previous swing high was ₹520. Price sells off, then bounces – but the bounce peaks at ₹498 before reversing again. That ₹498 is a lower high.
Lower Low (LL)
A lower low occurs when a decline pushes price below the previous swing low. The market does not just correct – it breaks through the prior support level and establishes a new, deeper trough.
Example: The previous swing low was ₹462. The next decline takes price to ₹441 before finding any pause. That ₹441 is a lower low.
Why Both Conditions Matter
It is tempting to call a downtrend the moment price makes a new low. But one lower low in isolation does not confirm bearish structure – it could be a shakeout, a news-driven spike, or a normal deep pullback within a broader uptrend.
What confirms bearish structure is the combination: lower highs and lower lows, occurring in sequence.
Here is why each component matters separately:
Lower highs tell you that rallies are failing. When a bounce cannot reclaim the previous peak, it signals that the pressure to the downside is stronger than the pressure to the upside during recovery attempts. The ceiling is dropping.
Lower lows tell you that supports are breaking. When each trough goes deeper than the last, it signals that whatever was previously absorbing selling pressure is no longer doing so. The floor is falling.
When both conditions are present together – falling ceiling and falling floor – the structure is unambiguously bearish. The trend is not just "weak"; it is actively organized to the downside.
Pro Tip – Bearish Confirmation: A lower low (LL) accompanied by high volume, followed by a lower high (LH) on low volume, is the "gold standard" for a confirmed bearish trend. The volume tells you that selling pressure is real on the way down, but buyers are absent on the bounce.
Distinguishing a Downtrend from a Pullback
This is where most intermediate traders struggle. During a healthy uptrend, price does not go up in a straight line. It makes higher highs and higher lows – which means it also has periods of decline. Those declines are pullbacks, not trend reversals.
So how do you tell the difference between:
A normal HH/HL pullback within an uptrend
The early stages of a genuine LH/LL downtrend
The answer lies in what happens to the previous swing low during the correction.
In a pullback within an uptrend, price corrects but holds above the prior swing low. The higher low structure remains intact. In the early stages of a downtrend, price declines through the prior swing low – creating a lower low – and the subsequent bounce fails to reach the prior swing high – creating a lower high.
The Transition: From Uptrend to Downtrend
The shift from HH/HL to LH/LL rarely happens overnight. Understanding the typical sequence of events helps you recognize it as it develops rather than after the fact.
Stage 1: Momentum Divergence
Often the first sign of structural weakening is not a lower high or lower low – it is a higher high that arrives with noticeably weaker momentum. Price is still technically making new highs, but the rally is narrower, slower, or accompanied by declining participation. This is the precursor, not the confirmation.
Pro Tip – Watch the "Time to Peak": If the previous rally to a Higher High took 5 days, but the current rally to a Higher High (or even a Lower High later) is struggling after 8 days, time is telling you that the bulls are exhausted even before the price turns.
Stage 2: Failure to Make a New High (First Lower High)
The first concrete structural warning: a rally that stalls and reverses before reaching the previous swing high. This creates the first lower high. At this point, uptrend structure is challenged but not broken – a lower high alone is ambiguous. It could still be a pause.
Stage 3: Break of the Prior Swing Low (First Lower Low)
The more significant event: price declines through a prior swing low. For traders watching HH/HL structure, this is the moment it breaks. The higher low that had previously held is now violated. This is a Change of Character (ChoCh) – the first structural warning. In the context of market structure reversal signals, this is the earliest concrete red flag.
Stage 4: Confirmation – Another Lower High
After the break of the swing low, price bounces. If that bounce creates another lower high – failing again to reach the prior swing high – bearish structure is now confirmed by repetition. You have LH → LL → LH, which is the beginning of a confirmed LH/LL sequence.
Stage 5: The Downtrend Is Established
Once you have at least two lower highs and two lower lows in sequence, you are looking at a structurally established downtrend. Every subsequent rally and decline that continues this pattern reinforces it.
Reading LH/LL on a Chart: Step-by-Step
Step 1: Mark all swing highs and swing lows on your chosen timeframe.
Use the same methodology as you would for uptrend analysis – identify clearly defined peaks and troughs, not arbitrary candles.
Step 2: Compare each swing high to the previous one.
Is the new swing high below the prior swing high? If yes, lower high confirmed. If the new swing high exceeds the prior one, the structure is either still bullish or recovering.
Step 3: Compare each swing low to the previous one.
Is the new swing low below the prior swing low? If yes, lower low confirmed. If the new swing low holds above the prior one, the bearish structure is weakening.
Step 4: Read the full sequence.
LH → LL → LH → LL = confirmed downtrend structure.
Step 5: Watch for deviations.
A higher low forming within a LH/LL sequence is the first sign the downtrend may be losing momentum – especially if it is followed by a higher high. This transition in reverse (downtrend → uptrend) is the structural recovery phase.
Common Mistakes in Reading Bearish Structure
1. Calling every dip a downtrend
A single lower low or one failed rally does not make a downtrend. You need the pattern to repeat. Premature structural calls lead to confusion when price recovers and reasserts the prior uptrend.
2. Ignoring the rally quality during a decline
Just as the quality of pullbacks matters in uptrends, the quality of rallies within downtrends is informative. A weak, low-momentum rally that quickly fails – barely retracing before rolling over again – confirms strong bearish pressure. A sharp, high-momentum rally that nearly reclaims the prior high signals structural weakness in the downtrend.
3. Applying the wrong timeframe
A stock can be in a downtrend on the daily chart while showing a short-term bounce on the 1-hour chart. Reading these as the same structure creates contradictory signals. Always specify the timeframe your analysis applies to.
4. Treating structure as a timing tool
LH/LL structure tells you the market is organized to the downside. It does not tell you when a move will happen or how deep it will go. Structure is context, not a trigger.
Multi-Timeframe Bearish Structure
The same principle of timeframe alignment that applies to uptrends applies here. Bearish structure on a higher timeframe (weekly or daily) provides context for interpreting moves on lower timeframes (4-hour or 1-hour).
When the daily chart is in a clear LH/LL sequence, any 1-hour chart rally that forms a lower high relative to the prior 1-hour swing high is consistent with the larger bearish structure. Conversely, when a lower timeframe starts showing higher lows within a daily downtrend, it is worth monitoring – it may be the beginning of a structural shift that has not yet appeared on the daily chart.
This layered reading of structure across timeframes is a standard part of how professional market analysis is conducted – not because it gives precise signals, but because it establishes the context within which individual price moves should be interpreted.
What Ends a Downtrend?
Bearish LH/LL structure ends the same way uptrend HH/HL structure begins: with a break of the pattern. The typical sequence from downtrend to recovery mirrors the five stages in reverse:
Momentum divergence to the downside – A lower low that arrives with noticeably weaker momentum (slower decline, narrower range, or declining volume)
Failure to make a new low (first higher low) – A pullback that holds above the prior swing low
Break of the prior swing high – Price rallies through a prior swing high – this is a Change of Character (ChoCh) to the upside
Confirmation – another higher low – After a pullback, price holds above the prior swing low again, creating a higher low
The uptrend is established – Once you have at least two higher highs and two higher lows in sequence, the HH/HL sequence has begun
There is often a period of ambiguity – called a ranging phase – between the end of a downtrend and the beginning of a new uptrend. During this phase, highs and lows are roughly equal rather than clearly declining or rising. The range-bound trading strategy post covers this state in detail.
Frequently Asked Questions
Q: Is a single lower low enough to confirm a downtrend?
A: No. A single lower low (LL) could be a "liquidity grab" or a deep pullback in a larger uptrend. A confirmed downtrend requires a sequence of both lower highs (LH) and lower lows (LL) to prove that the "ceiling" and the "floor" are both dropping.
Q: What is the difference between a pullback and a downtrend?
A: In a pullback, price declines but remains above the previous major swing low, maintaining the "higher low" structure. In a downtrend, price breaks below that previous swing low and the subsequent recovery fails to reach the previous peak.
Q: Why do lower highs matter more than lower lows for trend health?
A: Lower highs signal that the "buying power" is exhausting. When a market cannot even reach its previous peak during a rally, it shows that sellers are becoming aggressive at lower price points, which often precedes a break of support.
Q: What is a "Change of Character" (ChoCh) in a bearish context?
A: A Change of Character occurs when price breaks a previous higher low for the first time. While it doesn't confirm a full downtrend yet, it is the first structural warning that the bullish trend is over and a bearish or ranging phase is beginning.
LH/LL in the Structure Cluster
| Article | What It Covers |
|---|---|
| Higher highs and higher lows: market structure guide | Uptrend structure – the foundation |
| This post | Downtrend structure – LH and LL explained |
| Range-bound trading strategy | The third market state – sideways structure |
| Swing highs and swing lows explained | The raw building blocks for all structure analysis |
| Break of structure vs. change of character | When and how trends transition |
| Higher highs vs. equal highs: trend or fakeout? | Reading consolidation within an uptrend |
Summary
Lower highs and lower lows define the structural fingerprint of a downtrend. Here is the framework in brief:
- A lower high is a swing peak that fails to reach the previous swing peak – a declining ceiling
- A lower low is a pullback trough that drops below the previous trough – a falling floor
- The sequence LH → LL → LH → LL confirms bearish structure; one instance is not enough
- The transition from uptrend to downtrend moves through a sequence: momentum divergence → first LH → break of prior swing low (ChoCh) → confirmation with another LH
- The quality of rallies within a downtrend is as informative as the declines themselves
- Bearish structure ends when a rally produces a higher high and the subsequent pullback holds as a higher low – beginning the HH/HL sequence again
Market structure is not predictive. It is descriptive. A confirmed LH/LL pattern tells you how the market has been organizing itself – it is the starting point for every other form of analysis, not a conclusion in itself.
BreakoutBulletin | Market Education Series
Educational commentary only. Not investment advice. Past performance does not guarantee future results.