
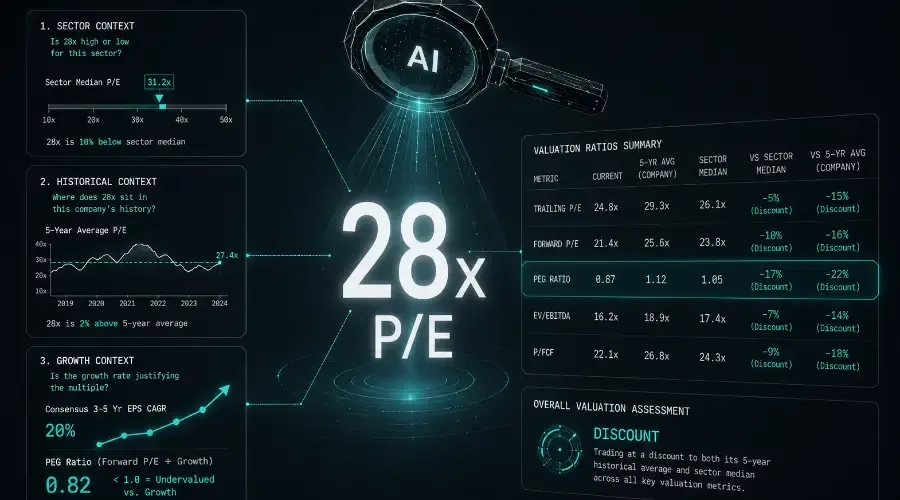
A P/E ratio of 28 tells you almost nothing on its own.
Is that expensive? Cheap? It depends entirely on the sector, the growth rate, the sector median, and where that company's own P/E has historically sat. A 28x P/E for a software company growing revenue at 30% annually might represent a meaningful discount to peers. The same 28x for an industrial manufacturer growing at 4% annually might represent an unjustified premium.
This is the core problem with how most retail traders use valuation ratios – they look at the number without the context that determines what the number means. The goal of AI stock valuation analysis is not to generate ratios for you, but to contextualise the ratios you bring to it against sector benchmarks and historical averages that make them analytically actionable.
Ratio contextualisation is the core valuation step in the Fundamental Research with AI workflow. It covers the full hub overview and how ratio analysis connects to screening, transcript review, and peer comparison.
Why Sector Context and Growth Rate Are Non-Negotiable
The S&P 500 trades at roughly 20 to 25x P/E in normal market environments. A stock at 35x looks expensive by that comparison – unless it sits in a high-growth software sector with a median P/E of 40x, growing revenue at 35% while the sector median grows at 20%. In that context, 35x might represent a discount.
The context that makes a P/E meaningful has three components: the sector median, the growth rate supporting the multiple, and the company's own historical average P/E. All three together produce a genuine assessment of discount, premium, or fair value. One component alone produces noise. This is the foundation of any credible AI financial ratio analysis framework.
The Key Ratios to Analyse Together
No single ratio provides a complete valuation picture. These five work as a set.
Trailing P/E
Market price divided by TTM earnings. Most useful as a historical comparison: is the current P/E above or below the company's 5-year average and the sector median? Its limitation is backward-looking – it reflects what the company earned, not what it's expected to earn.
Forward P/E
Market price divided by consensus next-12-month EPS estimate. The primary reference for growth stocks where earnings trajectory matters more than earnings history. The cornerstone of how to evaluate stock multiples using AI in a forward-looking framework.
PEG Ratio
Forward P/E divided by expected earnings growth rate. A PEG below 1.0 suggests the market is underpricing the stock relative to its growth. A PEG significantly above 1.0 suggests the market is pricing in growth that may be difficult to sustain.
Pro-tip: If you only have access to 1-year forward growth estimates, be aware that a "cyclical earnings peak" will make a stock look deceptively cheap. Always cross-reference the growth estimate against the sector's long-term cycle. The PEG denominator should ideally reflect a 3-5 year expected earnings CAGR rather than a single forward-year estimate.
Once you have a clear picture of how a single company's ratios compare to its own history and sector median, the natural next step is comparing those ratios across the peer group. How to Compare Companies Across Sectors Using AI covers how to structure the peer comparison table and what to ask AI to identify beyond the raw numbers.
EV/EBITDA
Enterprise value divided by EBITDA. This is the cleaner cross-company comparison metric for sectors with varying capital structures, because it operates above the interest expense line. A company heavily financed with debt shows a lower P/E not because its business generates more value, but because interest expense reduces net income. EV/EBITDA captures the debt in the numerator and removes the distortion.
Indicative ranges: 8–12x for mature industrials, 20x and above for high-growth technology – though these ranges shift with the interest rate environment and should be cross-checked against current sector data rather than treated as fixed benchmarks.
P/FCF
Price to free cash flow. The cleanest picture of what investors are actually paying for economic value generated, particularly for businesses where stock-based compensation or non-cash charges create a meaningful gap between reported earnings and real cash generation.
Valuation ratios tell you what the market is paying. Cash flow analysis tells you whether that price is grounded in real economics. How to Analyze Growth, Margins, and Cash Flow Using AI covers the free cash flow margin trajectory, the earnings quality check, and the working capital signals that validate or challenge what the valuation ratios imply.
A note on unprofitable companies:
For high-growth businesses with negative trailing earnings – common in early-stage technology and biotech – trailing P/E and forward P/E are not meaningful. In these cases, shift the primary metrics to Price-to-Sales (P/S), EV/Revenue, and forward revenue growth rate. Focus on the trajectory of gross margin and FCF burn rate as quality indicators rather than earnings-based multiples.
Formatting the Ratio Table for AI Input
The data comes from financial platforms – Koyfin, Macrotrends, or similar – not from the AI itself. The table should include the current ratio, the company's 5-year historical average, and the current sector median.
| Metric | Current | 5-Year Avg (Company) | Sector Median |
|---|---|---|---|
| Trailing P/E | 24.8x | 29.3x | 26.1x |
| Forward P/E | 21.4x | 25.6x | 23.8x |
| PEG Ratio | 0.87 | 1.12 | 1.05 |
| EV/EBITDA | 16.2x | 18.9x | 17.4x |
| P/FCF | 22.1x | 26.8x | 24.3x |
Best Practice for AI Reliability
Best Practice:
When running valuation, keep the thread dedicated. Do not paste 10 different companies into one chat; the AI may blend the sector medians and create faulty benchmarks.
The Prompt – With the 50% Premium Rule Built In
Act as a fundamental analyst conducting a valuation assessment of [Company].
I've provided a ratio table showing current metrics alongside the company's 5-year historical averages and the current sector median for [sector].
Ratio table: [paste]
Additional context: [revenue growth rate, consensus earnings growth estimate (3–5 year CAGR preferred), any significant recent changes in business model or capital structure]
Based only on the data I've provided:
(1) Assess each ratio individually – state whether the current reading represents a premium or discount to both the company's own historical average and the sector median. Quantify each premium or discount as a percentage.
(2) Identify the overall valuation picture across all ratios combined – is the company broadly at a premium, discount, or approximately fair value relative to its own history and sector?
(3) Assess whether the current growth rate justifies the forward P/E premium or discount relative to the sector median – reference the PEG ratio. If the forward P/E represents a premium greater than 50% over the sector median, explicitly assess whether business quality or growth vectors justify it, or flag it as an unjustified risk premium.
(4) Flag any ratio where the current reading diverges significantly from the others – where one metric tells a materially different valuation story from the rest – and explain what might account for the divergence.
(5) If any metric appears inconsistent with the growth or margin context provided, flag it for manual verification rather than incorporating it into the assessment.
Note: Historical averages are useful anchors but may not be mean-reverting if the business has fundamentally changed. If the business has undergone a material change (e.g., spin-off, M&A, massive pivot) in the last 18 months, prioritize current sector medians over the 5-year historical average. Flag any case where the historical average may be stale given the context I've provided.
Preserve all ratio figures exactly as provided. Do not introduce external valuation data or analyst price targets.
Format using Markdown headers. Bold all key percentage premiums and discounts.
Alphabet Q3 2024 – Valuation Contextualisation in Practice
Alphabet in Q3 2024 illustrates what a coherent AI financial ratio analysis looks like when the data tells a consistent story.
| Metric | Current | 5-Year Avg (GOOGL) | Mega-Cap Tech Median |
|---|---|---|---|
| Trailing P/E | 23.1x | 27.4x | 31.2x |
| Forward P/E | 19.8x | 23.9x | 26.7x |
| PEG Ratio | 0.82 | 1.08 | 1.31 |
| EV/EBITDA | 14.6x | 17.2x | 21.4x |
| P/FCF | 18.3x | 22.1x | 28.6x |
Additional context: revenue growth accelerating from 14% to 15% quarter-over-quarter; cloud revenue growing 35% and re-accelerating; operating margin at 32% versus 5-year average of 26%; consensus 3-year earnings CAGR approximately 20%.
What the output identified:
Alphabet was trading at a discount to its own 5-year historical average on every single metric – forward P/E 17% below its own average, EV/EBITDA 15% below, P/FCF 17% below.
Simultaneously, it was at a discount to the mega-cap technology peer median across all five metrics – forward P/E 26% below peer median, EV/EBITDA 32% below.
The consistency of the discount across all five independent metrics – rather than a mixed picture – was characterised as a notably coherent signal. The PEG of 0.82 against a peer median of 1.31 indicated the market was pricing Alphabet at a discount to its growth rate while pricing peers at a significant premium to theirs. No metric diverged from the directional story, which reduced the risk that any single ratio was producing a misleading reading.
The model concluded with the correct framing: this identifies a discount relative to historical norms and peer medians. It does not identify a catalyst for that discount to close or a timeline for market repricing. Valuation analysis identifies where price and fundamental value appear misaligned. Whether and when the market corrects that misalignment is outside the scope of the analysis.
Where Ratio Analysis Fits in the Research Workflow
Valuation contextualisation belongs after screening has identified candidates worth examining and before the deeper transcript and filing work. The ratio analysis answers: is this stock cheap or expensive relative to its own history and its peers? The transcript analysis answers: does management commentary support the fundamental premise the valuation implies? The filing analysis answers: does the financial structure confirm the quality the metrics suggest?
Together they build the fundamental picture. Any one in isolation is informative but incomplete.
Frequently Asked Questions
Q1: Why shouldn't I just ask an AI if a stock is cheap or expensive?
Standard AI models excel at processing structures, not speculating on direction. If you simply ask whether a stock is cheap, the model will likely pull a trailing P/E in isolation and return a generic answer. This framework forces AI to act as an analytical filter by cross-referencing the multiple against three distinct baselines: sector peers, the company's own 5-year historical average, and its forward growth rate via the PEG. The value is in identifying structural disconnects, not in guessing directional movement – which is why prompts for AI stock valuation analysis need to be structured rather than open-ended.
Q2: Why does this framework emphasise EV/EBITDA over traditional P/E?
The standard P/E ratio is distorted by capital structure. A company with significant debt carries high interest expenses, which reduces net income and can make the stock appear deceptively expensive on a P/E basis. EV/EBITDA treats the entire business as if bought outright – debt included – and evaluates pure operational cash generation before capital structure effects, taxes, or accounting depreciation create distortion. For sectors where debt levels vary meaningfully across the peer group, EV/EBITDA is the cleaner cross-company comparison metric for forward PE vs trailing PE analysis.
Q3: What should I do if the AI flags a stock as historically cheap but expensive relative to its sector?
This conflict typically signals a structural industry shift or growth deceleration. A stock trading at a steep discount to its own 5-year history but at a premium to the sector median often indicates the market has permanently re-rated the company down – lost market share, margin compression, or macro headwinds that have changed the fundamental baseline. In this scenario, use the earnings call transcript analysis framework from the previous post to look for structural margin compression or guidance cuts that explain why the historical average may no longer be a valid anchor.
Q4: Can this AI valuation framework predict market turning points or bottoms?
No – and attempting to use it as a timing tool is a critical misapplication. Valuation analysis identifies discrepancies between price and fundamental value. It does not track short-term institutional flow, sentiment cycles, or technical momentum. A stock identified as fundamentally undervalued can remain at that discount for months or years before the market corrects it. Use this AI filtering method to build a high-probability watchlist, then cross-reference with volume-weighted technical tools – VWAP, structural breakouts, or relative strength – to time actual entries. The valuation layer tells you what to watch. The technical layer tells you when to act.