
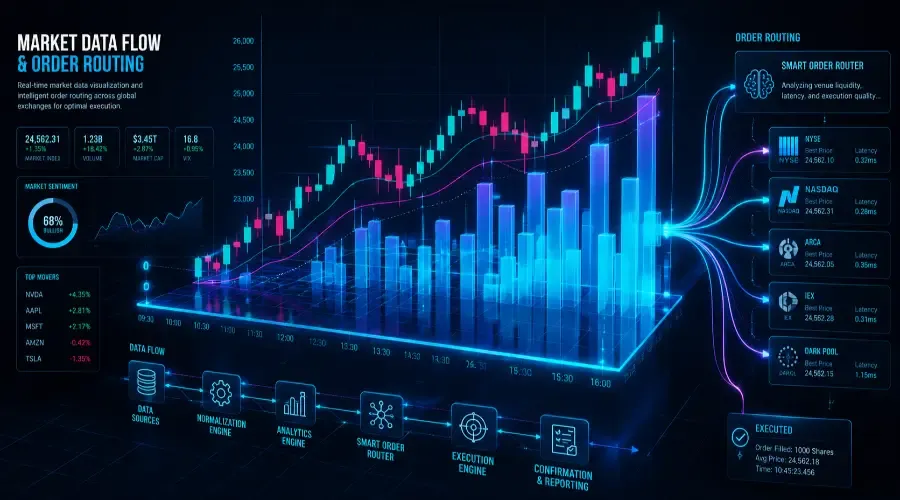
The stock market is referenced in news coverage every trading day. Most people who interact with it – buying mutual funds, checking a 401(k), or placing their first brokerage trade – understand the surface but not the infrastructure underneath. This guide covers the full picture: the exchanges where trades happen, who facilitates them, how prices form, what indices measure, when you can trade, what protections exist when markets move violently, and how to read the market's daily output accurately.
What the Stock Market Actually Is
The stock market is not a single place. It's a network of exchanges, electronic systems, and market participants that collectively enable buyers and sellers of publicly traded shares to transact at agreed-upon prices.
When someone says "the market was up today," they're referring to aggregate price movement across a large group of stocks – typically summarized by an index like the S&P 500. That movement reflects the collective opinion of millions of participants about the current and expected future value of those businesses.
The market doesn't set stock prices. Market participants do, through the continuous interaction of supply (sellers) and demand (buyers). Prices rise when buyers outnumber sellers. Prices fall when sellers outnumber buyers. Every price you see on a financial platform represents the most recent transaction between a willing buyer and a willing seller.
The Exchanges: Where Stocks Trade
NYSE (New York Stock Exchange), founded in 1792, is the world's largest stock exchange by market capitalization of listed companies. It maintains a physical trading floor in lower Manhattan – visible in news coverage – though most transactions now route electronically. NYSE lists approximately 2,800 companies. Listing standards require demonstrated profitability, minimum market capitalization, and corporate governance compliance. NYSE listings tend toward established, profitable businesses: Walmart, Coca-Cola, JPMorgan Chase, Disney.
NASDAQ, launched in 1971 as the world's first fully electronic exchange, lists approximately 3,300 companies. It has no physical trading floor – all matching is algorithmic. NASDAQ's listing standards have historically been more accommodating to earlier-stage growth companies, producing a roster heavily weighted toward technology: Apple, Microsoft, Amazon, Tesla, Nvidia. The exchange handles extremely high trading volumes with minimal latency, which suits the fast-moving technology stocks that dominate its listing.
OTC (Over-the-Counter) markets are where companies that don't meet NYSE or NASDAQ listing requirements trade. OTC markets are less regulated, have lower disclosure requirements, and carry meaningfully higher risk. Thinly traded OTC stocks are subject to wider bid-ask spreads, lower liquidity, and – in some cases – price manipulation schemes. For most investors, avoiding OTC-listed stocks entirely is a reasonable default.
You never contact exchanges directly. Your broker routes your orders automatically to the appropriate exchange or to a market maker. The exchange then matches your order with a counterpart and executes the trade.
Market Hours
U.S. stock markets operate on a fixed schedule: 9:30 AM to 4:00 PM Eastern Time, Monday through Friday, excluding U.S. federal holidays. The 9:30 AM start is the opening bell. The 4:00 PM end is the closing bell.
Markets close on New Year's Day, Martin Luther King Jr. Day, Presidents Day, Good Friday, Memorial Day, Juneteenth, Independence Day, Labor Day, Thanksgiving, and Christmas. Some holidays produce early closes at 1:00 PM ET rather than full closures.
Pre-market trading can begin as early as 4:00 AM ET and runs until 9:30 AM ET, though many brokers don't activate pre-market access until 7:00 AM ET. After-hours trading runs from 4:00 PM to 8:00 PM ET. Both are available through most major brokerages, but both carry important limitations: volume is dramatically lower, bid-ask spreads are wider, and prices can move sharply on limited activity. A stock showing a $0.05 spread during regular hours may show a $0.50 to $1.00 spread at 7:00 AM.
Orders placed outside regular market hours queue for the next session if they're market orders. A market order placed at 7:00 PM on a Tuesday executes at whatever price the stock opens the following morning – which may differ substantially from the previous close if news breaks overnight.
The gap risk: Stocks can "gap" at the open – the first trade of the day printing at a significantly different price than the previous close. A company reporting strong earnings after hours may open 10% higher. A company issuing a profit warning may open 15% lower. Investors holding overnight experience the full move without the ability to react during the gap itself.
Practical defaults: Trade during regular market hours (9:30 AM to 4:00 PM ET) using limit orders if you must transact outside those hours. Avoid market orders placed overnight – they accept whatever price materializes at the open.
Market Makers: The Hidden Infrastructure
When you tap "buy" on a stock and the order fills within a second, a market maker is typically the counterpart – especially for retail orders routed through payment for order flow. Market makers are firms – Citadel Securities, Virtu Financial, and Jane Street are the largest – that continuously quote two prices for every stock they cover: the bid (they'll buy from you) and the ask (they'll sell to you). The ask is always higher than the bid.
By posting continuous two-sided quotes, market makers ensure that investors can buy or sell at any moment during market hours without needing to find a matching counterpart in real time.
How they profit: The spread between bid and ask is the market maker's compensation. On Apple with a $0.04 spread and 50 million shares trading daily, the potential daily spread revenue on that single stock alone approaches $2 million. Multiplied across thousands of stocks, major market-making operations generate billions annually.
Spreads on liquid vs. illiquid stocks: Competition among market makers on large-cap stocks keeps spreads razor-thin – often $0.01 to $0.05 on stocks like Apple or Microsoft. On thinly traded stocks, market makers face much higher inventory risk and widen spreads dramatically. A $2.50 stock with a $0.40 bid-ask spread imposes a 16% round-trip cost before the stock moves at all. An investor who buys at $2.70 and immediately tries to sell receives $2.30 – a 15% loss from the spread alone.
Payment for order flow: Most retail brokers don't route orders directly to exchanges. They sell the right to execute retail orders to market makers – a practice called payment for order flow (PFOF). Citadel Securities pays Robinhood approximately $0.002 per share for the privilege of handling its order flow. The market maker captures the spread; the broker earns revenue without charging explicit commissions. "Commission-free" trading is subsidized by the implicit cost of the spread.
On liquid, high-volume stocks during regular hours, this arrangement typically works fine for retail investors – spreads are negligible and execution is fast. On illiquid names or during extended hours, the quality difference can be meaningful.
How Prices Form: Supply, Demand, and the Bid-Ask Spread
Every stock has two prices at any given moment: the bid (the highest price a buyer is currently willing to pay) and the ask (the lowest price a seller is currently willing to accept). When you buy, you pay the ask. When you sell, you receive the bid.
The spread between them is an implicit transaction cost that appears on no confirmation statement but is paid on every trade. On Apple, that cost is negligible – fractions of a percent. On a thinly traded small-cap, it can be the dominant factor in whether a trade is profitable.
Market orders vs. limit orders:
A market order instructs your broker to execute immediately at the best available price. You get near-certain execution but no guarantee on the exact price. On liquid stocks during calm conditions, the execution typically matches the quoted price within pennies. On volatile stocks or during the opening and closing 15-minute windows (when volume spikes and spreads widen), slippage – the gap between expected and actual execution price – can be material.
A limit order specifies the exact price at which you're willing to transact. A buy limit at $48 on a stock trading at $50 only executes if the price reaches $48. You control the price but not execution certainty – if the stock never reaches $48, the order sits unfilled.
Order duration:
Day orders expire at 4:00 PM ET on the day placed. Good-Till-Canceled (GTC) orders remain active until filled or manually canceled, typically up to 90 days. The practical risk of GTC orders: a position entered during a moment of conviction may fill weeks later under conditions that no longer support the original reasoning. Weekly review of open GTC orders prevents this.
Slippage and when it matters most:
The first 15 to 30 minutes of trading (9:30 to 10:00 AM ET) and the final 15 to 30 minutes (3:30 to 4:00 PM ET) see the highest concentration of institutional order flow, widest spreads, and greatest slippage risk. Midday trading – roughly 10:30 AM to 3:00 PM ET – tends to be calmer, with more predictable fills for market orders on liquid stocks.
Liquidity: The Hidden Variable in Every Trade
Liquidity describes how quickly and easily you can convert an investment into cash at a price close to its quoted value. High liquidity means you can sell instantly at the quoted price. Low liquidity means accepting a substantial discount, waiting for a buyer, or both.
Measuring liquidity: Two metrics provide a fast read on any stock's liquidity.
Average daily trading volume tells you how many shares change hands per day. Stocks trading more than 1 million shares daily are generally liquid – your order is a small fraction of total activity and won't move the price. Stocks trading below 100,000 shares per day are thinly traded – your order may represent a significant fraction of the day's volume and can move the price against you.
Bid-ask spread as a percentage of price expresses the cost of immediate liquidity. A spread of $0.04 on a $180 stock represents 0.02% – negligible. A spread of $1.60 on an $8 stock represents 20% – catastrophic.
The illiquidity trap: "Cheap" stocks with low per-share prices often carry wide spreads and thin volume. A stock priced at $3 looks affordable. If the bid is $2.40 and the ask is $3.60, a round-trip trade loses 40% to the spread before the stock moves at all. Many retail investors have learned this lesson expensively.
Pump-and-dump schemes rely on illiquid stocks because thin trading allows small coordinated groups to push prices dramatically. Aggressive social promotion of low-volume stocks is a reliable negative signal.
A practical liquidity filter: Before buying any stock, check daily average volume (minimum 1 million shares) and the bid-ask spread as a percentage of price (maximum 0.5%). Stocks that fail either criterion impose transaction costs that make the investment harder to justify regardless of the fundamental story.
Stock Market Indices: How the Market Gets Measured
When someone says "the market is up 1.2% today," they're referencing an index – a calculated value that tracks the performance of a specific group of stocks and collapses it into a single number updated continuously during trading hours.
Indices serve two purposes: daily market pulse (are things broadly rising or falling?) and investment benchmark (how did your portfolio perform relative to the market average?).
The S&P 500
The S&P 500 tracks 500 large U.S. companies selected by a committee at S&P Dow Jones Indices based on market capitalization, profitability, liquidity, and industry representation. It covers approximately 80% of total U.S. stock market value by capitalization and is the primary benchmark used by professional investors, financial media, and most retail investors.
The index is market-cap weighted: larger companies have proportionally larger influence on daily movements. As of 2024-25, the top 10 holdings – Apple, Microsoft, Amazon, Nvidia, Alphabet, Meta, Berkshire Hathaway, Tesla, Eli Lilly, and Broadcom – represent roughly 35% of the entire index.
Since its inception in 1957 (with predecessor data extending back to 1928), the S&P 500 has returned approximately 10% per year on average, including dividends reinvested. That figure spans the Great Depression, World War II, multiple recessions, the 2000 dot-com collapse, the 2008 financial crisis, and the 2020 pandemic crash. Note that the commonly quoted index level (e.g., "S&P 500 at 5,500") reflects price changes only, excluding dividends; the total return that investors experience includes dividends reinvested.
How to invest in it: You can't buy the S&P 500 directly. You buy a fund that tracks it. Three major ETFs replicate the index: VOO (Vanguard, expense ratio approximately 0.03%), SPY (State Street, approximately 0.095%), and IVV (iShares, approximately 0.03%). All three hold the same underlying stocks in the same proportions. Most brokerages allow fractional share purchases, meaning $25 or $50 buys a proportional slice regardless of the current per-share ETF price.
The S&P SPIVA scorecard shows that approximately 85 to 90% of actively managed U.S. large-cap funds underperform the S&P 500 over 15-year periods – making the passive index fund approach the empirically stronger choice for most investors.
The Dow Jones Industrial Average
The Dow Jones Industrial Average (DJIA) tracks 30 large U.S. companies selected by editors at S&P Dow Jones Indices. Founded in 1896, it's the oldest major U.S. stock index and the most-cited in mainstream media.
The Dow uses price weighting rather than market-cap weighting – a company's influence on the index is proportional to its share price, not its total market value. A stock trading at $300 moves the Dow three times as much as a stock trading at $100, regardless of which company is larger by market cap. This is a structural limitation relative to the S&P 500, which more accurately reflects each company's actual economic scale.
The Dow covers roughly 25% of total U.S. stock market capitalization versus the S&P 500's 80%. For portfolio benchmarking, the S&P 500 is the more representative reference. The Dow remains useful for quick daily market pulse and historical context – it has data going back to 1896, making it the only index with meaningful coverage across that full span.
Points vs. percentages: Media coverage emphasizes points – "the Dow fell 600 points today." At a Dow level of 42,000, a 600-point drop is 1.43%. At 10,000, the same 600 points would be 6% – four times the proportional impact. Always convert to percentage to assess significance.
The NASDAQ Composite
The NASDAQ Composite includes every company listed on the NASDAQ exchange – approximately 3,000 stocks. It's market-cap weighted and heavily tilted toward technology: Apple, Microsoft, Nvidia, Amazon, and Alphabet together represent a substantial share of the total index value. Technology and technology-adjacent sectors represent approximately 50% of the Composite by weight.
The NASDAQ is more volatile than the S&P 500. Technology companies tend to be valued on future earnings expectations rather than current profits, making them more sensitive to interest rate changes. During the 2022 rate-hiking cycle, the NASDAQ fell approximately 33% while the S&P 500 fell roughly 18%. In technology-driven bull markets, the pattern reverses – the NASDAQ frequently outpaces the S&P 500.
The NASDAQ Composite and the NASDAQ-100 are distinct. The Composite includes all 3,000-plus NASDAQ-listed stocks. The NASDAQ-100 is the 100 largest non-financial NASDAQ companies – tracked by QQQ (Invesco QQQ Trust, expense ratio approximately 0.20%). When investors say they're buying "the NASDAQ," they typically mean QQQ.
Bull and Bear Markets
Two terms describe the market's broad directional trend over sustained periods.
A bull market is a period in which stock prices rise 20% or more from a recent low, typically accompanied by economic growth and investor confidence. Since 1950, bull markets have averaged four to five years in duration.
A bear market is a decline of 20% or more from a recent high, typically accompanied by economic contraction or rising uncertainty. Bear markets have averaged nine to twelve months in duration over the same period.
In practice, both bull and bear markets are generally confirmed only after the move has been sustained over a period of months, not just an intraday breach of the 20% threshold. The definitions are useful frameworks, but market historians often date the official start and end retroactively.
The historical record: Since 1950, the S&P 500 has experienced 13 bear markets. Over the full period, investors who stayed invested through both bull and bear markets earned approximately 10% annually. Those who sold during bear markets and waited for more favorable conditions to re-enter historically earned 3 to 5 percentage points less annually – a gap that compounds enormously over decades.
What drives each: Bull markets form when corporate earnings grow, unemployment falls, and investors expect conditions to improve. Confidence feeds itself – rising prices attract more buyers, which pushes prices further. Bear markets follow the reverse: slowing earnings, rising rates, or economic shocks trigger selling, which feeds more selling. Sentiment deteriorates faster than fundamentals, which is why prices often fall more sharply than underlying business performance justifies.
The most common mistake: Waiting for the right market conditions to invest. Bull markets feel too expensive to buy into. Bear markets feel too risky. The result is sitting in cash while both phases pass. Research on missing the market's best trading days illustrates this concretely: missing the 10 best days in any decade roughly halves long-term returns versus staying fully invested.
Circuit Breakers and Trading Halts
Markets have built-in pause mechanisms for extreme volatility – both at the individual stock level and market-wide.
Market-wide circuit breakers are measured as percentage declines from the S&P 500's prior-day closing level.
Level 1 triggers at a 7% decline, halting trading for 15 minutes. It can only activate before 3:25 PM ET – in the final 35 minutes of the session, the market trades through to the close regardless. Level 1 has triggered four times total – all in March 2020 during the COVID-19 pandemic's initial market shock.
Level 2 triggers at a 13% decline, halting for another 15 minutes. Same time restriction. Level 2 has never triggered in U.S. market history.
Level 3 triggers at a 20% decline, closing trading for the remainder of the day with no time restriction. Level 3 has never triggered.
Individual stock halts (LULD – Limit Up/Limit Down) occur when a stock moves more than a specified percentage within a five-minute window. The threshold is 5% for stocks above $3 and 10% for stocks between $0.75 and $3. When triggered, trading pauses for 5 minutes while participants assess whether the move reflects genuine information or a technical anomaly.
Regulatory suspensions are different and more serious. The SEC can suspend trading in a single stock for up to 10 trading days when it has concerns about the accuracy of public information or potential manipulation. A suspension indicates the SEC identified a specific concern serious enough to remove trading access entirely.
How to respond to a halt: Use the pause time to read the news, check the company's investor relations page, and determine what triggered the move. Market orders placed into a post-halt reopening auction can fill at prices substantially different from the pre-halt level. Limit orders provide more control in these conditions.
Short Selling: The Other Direction
Most investors buy stocks expecting prices to rise. Short sellers profit from declines.
The mechanics: you borrow shares from your broker, sell them immediately at the current price, and the cash proceeds are held as collateral in your margin account (you don't have free access to that cash). To close the position, you buy shares back on the open market and return them to the broker. If the price declined during the interval, you profit the difference. If it rose, you absorb the loss – with no ceiling on potential losses.
Maximum gain on a short is 100% – if the stock goes to zero. Maximum loss is unlimited – if the price keeps rising. A stock shorted at $50 that rises to $500 produces a 900% loss on the position.
Short squeezes: When a heavily shorted stock begins rising, short sellers must buy shares to limit losses. That buying increases demand, which pushes the price higher, which forces more short sellers to cover, which pushes the price higher still. GameStop in January 2021 is the most documented example: from approximately $20 to a peak near $483 within three weeks, driven by coordinated retail buying against a heavily shorted position (short interest exceeded 100% of float). Melvin Capital, heavily short, lost 53% of its fund value in January 2021 alone and required a $2.75 billion emergency infusion.
Short selling requires a margin account, active monitoring, ongoing borrowing cost management, and the discipline to hold through adverse moves. The structural risk profile – unlimited downside, ongoing costs, and squeeze potential – makes it unsuitable for most investors. Understanding how it works illuminates market dynamics without requiring participation.
Reading Market Data Accurately
Points vs. percentages (revisited): "Dow up 500 points" sounds significant. At 44,000, that's 1.1% – a routine daily move. Percentages tell you the actual magnitude. Points are useful only in context.
Daily moves vs. trends: The stock market is positive in approximately 55% of individual trading sessions. Daily movements are noise. The signal emerges over weeks, months, and years. An investor who checks prices hourly is optimizing for anxiety, not outcomes.
Market cap vs. cash: A company's market capitalization is not its cash balance. A $50 billion market cap company may hold $800 million in actual cash. If the business deteriorates, the company can spend only what it holds – not what the market says it's worth.
"The market" vs. your portfolio: If your holdings are concentrated in technology stocks, the NASDAQ Composite is a more relevant benchmark than the Dow. If you hold a diversified cross-section of U.S. companies, the S&P 500 applies. Using the wrong benchmark produces misleading conclusions about performance.
Benchmark comparisons: If your portfolio grew 8% over a year while the S&P 500 grew 14%, that 6-point gap is worth examining – it may reflect sector exposure, individual stock selection, or the period's dynamics. Consistently trailing the S&P 500 by a meaningful margin over several years suggests the index itself may serve your portfolio better as its primary holding.
The Practical Framework
Understanding market structure changes how you operate within it.
You don't interact with exchanges directly – your broker handles routing, which means the quality and cost of execution depend partly on your broker's routing practices and partly on the order type you choose.
Spreads are invisible transaction costs. They're negligible on liquid large-cap stocks and substantial on thinly traded names. Checking the bid-ask spread before any trade takes five seconds and prevents paying 10 to 20% to the spread before the stock moves at all.
Market hours matter for order execution. Orders placed after 4:00 PM queue for the next session, where conditions may differ from when you placed the order. Extended hours trading carries wider spreads and lower liquidity.
Circuit breakers exist to provide time for assessment during extreme volatility. When they trigger, the instinct to act immediately is understandable but usually counterproductive. The pause is specifically designed to enable calm evaluation.
Indices are measuring tools, not tradeable assets. You invest in the index by buying funds that track it – at costs as low as 0.03% annually.
This content is for educational purposes only and does not constitute investment, legal, or tax advice. Investing in securities involves risk, including possible loss of principal. Past performance does not guarantee future results. Always conduct your own research and consult a licensed financial professional before making investment decisions.
Related reading on BreakoutBulletin.com:
This guide covers the full infrastructure of the stock market - exchanges, pricing, indices, market makers, and what happens during extreme volatility. The sections below cover each area in detail. Follow whichever thread matches your current question.
→ How Markets Function → Hub covering exchanges, liquidity, market makers, and circuit breakers - www.breakoutbulletin.com/article/how-stock-market-works-behind-the-app
→ Stock Market Indices Explained → Hub covering the S&P 500, Dow Jones, and NASDAQ - www.breakoutbulletin.com/article/how-stock-markets-function-exchanges-liquidity
→ How the Stock Market Actually Works → The mechanics of trading from order to execution - www.breakoutbulletin.com/article/how-the-stock-market-works-for-teens-a-simple-guide-to-buying-and-selling-stocks
→ Bull vs. Bear Markets → How to read sustained market direction and what drives each phase - www.breakoutbulletin.com/article/bull-vs-bear-markets-for-teens
→ The S&P 500 Deep Dive → What the index actually tracks and how to invest in it - www.breakoutbulletin.com/article/sp-500-for-teens-guide
→ Understanding Liquidity → The hidden variable that determines your true transaction cost - www.breakoutbulletin.com/article/liquidity-explained-stock-market-for-beginners
The next step is understanding what companies do with their equity once they’re public.
→ Corporate Actions Explained → IPOs, dividends, buybacks, splits, and secondary offerings - www.breakoutbulletin.com/article/guide-to-corporate-actions