
The five posts that precede this one cover the three clean market states – uptrend, downtrend, and range – and the mechanics of how they transition. But real charts are rarely that clean. The most common ambiguity traders encounter is not between an uptrend and a downtrend. It is between an uptrend that is still intact and one that is quietly stalling – producing what looks like a continuation but is actually a distribution phase in progress.
Here's the thing: the specific pattern that creates this ambiguity is equal highs.
When price makes a new swing high that matches, rather than exceeds, the prior swing high, the structure falls into a grey zone. It is not a higher high, so the uptrend is not being confirmed. But it is not a lower high either, so the trend is not yet broken. Traders misread this zone constantly – either dismissing it as normal consolidation when a real structural problem is developing, or declaring a trend over prematurely when price is simply building for continuation. Understanding the difference between equal highs vs higher highs is what separates traders who see the grey zone from those who get trapped by it.
This post covers how to read equal highs and equal lows with structural precision: what they signal, how they differ from genuine HH/HL continuation, when they are a pause inside a healthy trend, and when they are the early warning of a fakeout or reversal. This is the sixth and final post in the BreakoutBulletin structure series, and it is the one that makes the others complete – because it covers the ambiguous cases the earlier posts deliberately set aside.
Disclosure: Nothing on this page constitutes a recommendation to take any position in any security.
Defining Equal Highs and Equal Lows
An equal high (sometimes written EQH) occurs when a new swing high reaches approximately the same level as the prior swing high – neither clearly exceeding it nor clearly failing below it. The market returns to a prior resistance level, tests it, and stalls.
An equal low (EQL) is the mirror image: a new swing low reaches approximately the same level as the prior swing low, testing prior support without clearly breaking it.
The word "approximately" is doing important work here. Markets are not precise to the rupee. Equal highs are rarely at an identical price – they are within a zone, typically the same resistance band the prior swing high established. A general rule: if the second swing high is within 0.5–1% of the first (or within the same visible congestion zone on the chart), treat it as an equal high. The exact percentage depends on the instrument's average volatility – tighter for indices, wider for crypto or penny stocks. The analytical question is not whether two swing highs are at the exact same number. It is whether the second rally has or has not meaningfully exceeded the first – whether the uptrend's pattern of making new, higher peaks is continuing or has stalled.
Why Equal Highs Form: Three Structural Scenarios
Equal highs do not all mean the same thing. The structural significance depends heavily on the context in which they form. There are three distinct scenarios. The table below gives you a quick visual reference – then we'll walk through each one in detail.
| Scenario | Behavior of Lows | Underlying Logic | Likely Resolution |
|---|---|---|---|
| Consolidation (Bullish) | Rising Lows | Bullish compression, accumulation | Upside Breakout (BOS) |
| Distribution (Bearish) | Falling or Flat Lows | Selling pressure, distribution | Downside Break (ChoCh) |
| Fakeout Trap | N/A (instant break) | Liquidity grab, false higher high | Sharp reversal |
Scenario 1: Consolidation Within an Uptrend (Bullish)
The most common context for equal highs in a rising market is a consolidation phase – a pause within the broader uptrend before continuation. Price reaches a resistance level, cannot immediately push through, and oscillates in a tight range just below that level. The equal highs in this case are multiple failed attempts to break resistance, after which the market gathers enough momentum to push cleanly through.
The structural clue: the lows during this consolidation are rising. Price is making equal highs but higher lows – compressing into a narrowing structure where the floor is rising even while the ceiling holds. This asymmetry between the behavior of highs and lows is the most reliable signal that equal highs are consolidation rather than distribution. In bullish vs bearish consolidation terms, this is the bullish camp.
On a chart, this often appears as an ascending triangle – a pattern covered in depth in the triangle chart patterns post in this series. The flat resistance line is the equal highs; the rising trendline connecting the higher lows is the compression signal. The distinction between an ascending triangle vs distribution comes down to the lows: rising lows mean accumulation, flat or falling lows mean trouble.
Scenario 2: Distribution at a Peak (Bearish)
The second scenario is structurally opposite. Price reaches a significant level – often a prior major swing high, an all-time high, or a key round number – and repeatedly tests it without breaking through. Each test forms an equal high. During these tests, the lows on the pullbacks are not rising – they are flat or falling.
This is distribution. Participants who accumulated during the uptrend are reducing exposure at the resistance level across multiple sessions. Each rally attempt runs into this supply and stalls at the same level. The equal highs are not a consolidation before a breakout – they are the market repeatedly failing to sustain any advance beyond the resistance zone. This is a classic accumulation vs distribution price action signal: distribution is winning.
The structural clue here is the behavior of the lows between the equal highs. If the lows are progressively lower – even subtly – while the highs remain equal, you are looking at a coiling structure that is tilted to the downside, not the upside. The asymmetry is reversed: a falling floor with a flat ceiling.
Scenario 3: The Fakeout Setup
The third scenario is the most dangerous for traders who rely exclusively on price level rather than structural context. Price breaks marginally above a prior swing high – technically forming a higher high – but the breakout immediately fails and price reverses sharply below the prior swing high level.
This is not a genuine higher high. It is a false breakout above resistance, followed by a sharp reversal. The marginal new high was enough to trigger reactions from participants who were positioned for a breakout, creating the fuel for a swift downside move when those positions were stopped out. That's a classic market structure fakeout in action.
This scenario is the "fakeout" – where what looks like HH/HL continuation on a surface reading is actually a trap. The resulting structure, once the reversal completes, is often a sharp move into lower low territory – which, in the BOS/ChoCh framework from the previous post, means the marginal higher high was a false breakout and the subsequent break below the prior swing low is a ChoCh (Change of Character). The transition from an apparent uptrend directly into the early stages of a downtrend can skip the ambiguous equal high phase entirely.
How to Read Equal Highs with Structural Precision
Given that equal highs can mean opposite things depending on context, the analysis framework needs to go beyond "are these highs at the same level?" Here is a systematic approach:
Step 1: Examine the Lows
This is the most important step. While the highs are equal, what are the lows doing?
Rising lows: Compression into resistance – typically bullish context, consistent with a consolidation before continuation
Flat lows: True sideways range – the post on range-bound trading strategy applies directly here
Falling lows: Distribution structure – the equal highs are a ceiling that is holding while the floor erodes underneath
Step 2: Assess the Momentum of Each Test
The first test of a resistance level and the fourth test are not equivalent events. Repeated tests of the same resistance level with no meaningful breakthrough progressively weaken that level – but they also reveal whether the market is approaching it with increasing or decreasing momentum.
A high that reaches resistance on a wide, strong candle is a different signal from one that barely crawls to the same level on a narrow, weak candle. Weakening momentum on successive equal highs suggests the rally is running out of energy. Consistent or improving momentum on each test suggests accumulating pressure that may eventually produce a genuine breakout.
Step 3: Watch the Volume Pattern
Volume behavior across multiple equal highs is informative in ways that price alone is not.
Rising volume on tests of resistance: Suggests increasing participation at that level – either accumulating supply (distribution) or building enough demand to eventually break through
Declining volume on successive tests: Classic compression signal – the market is coiling, reducing range, and often precedes a volatility expansion in either direction
Volume spike on the breakout attempt: The move that finally breaks through (or fails to) on notably higher volume than the preceding tests carries more structural weight than a low-volume breach
Pro Tip: Effort vs. Result
To separate accumulation from distribution, watch the "effort vs. result." If price hits equal highs on massive volume (effort) but cannot close above them, hidden supply is likely present – that's distribution. Conversely, if volume is light on the test but heavy on the subsequent push above resistance, that suggests accumulation. In other words, volume reveals the conviction behind the test.
Step 4: Check the Higher Timeframe Context
Equal highs on a lower timeframe look very different depending on the higher timeframe structure. Equal highs on the hourly chart within a daily uptrend (HH/HL on the daily) are almost certainly consolidation. Equal highs on the daily chart at a major weekly resistance level after a prolonged trend are a much more significant structural event.
As with every structural concept in this series, the higher timeframe provides the context that determines how to interpret the lower timeframe pattern.
Equal Lows: The Mirror Framework
Everything above applies symmetrically to equal lows in a downtrend. You can apply the same equal lows trading strategy framework in reverse.
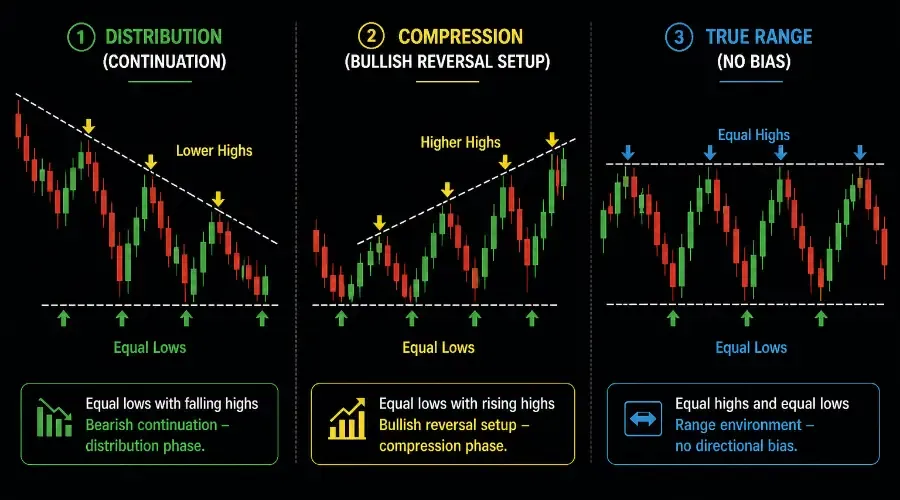
Rising lows within a downtrend: Equal lows with falling highs are distribution – the downtrend continuing under a flat ceiling, consistent with a descending triangle structure. The triangle chart patterns post covers this geometry in detail.
Equal lows with rising highs: Compression before potential upside breakout – a structure where the floor is holding while the ceiling drops, coiling for resolution.
Equal lows with flat highs: True range – equal highs and equal lows, no directional bias in the structure.
The fakeout scenario also applies in reverse: a marginal breach below a prior swing low that immediately reverses and snaps sharply back above it is a false breakdown – often the beginning of a strong upside move as participants who were positioned for a breakdown are forced to reverse. That snap–back is a ChoCh to the upside in the BOS/ChoCh framework.
Equal Highs and the Break of Structure
The connection between equal highs and the BOS/ChoCh framework from the previous post is direct.
When equal highs form and price subsequently breaks above them on a genuine close – not a wick – that breakout is a BOS to the upside. It resolves the ambiguity: the consolidation interpretation was correct, and the trend is resuming. The equal highs zone transitions from resistance to potential support on any subsequent pullback.
When equal highs form and price subsequently breaks below the lows of the consolidation – the lows that formed between the equal highs – that break is a ChoCh. The market has not managed to push through resistance and has instead broken the support of the consolidation structure. This is the structural signal that the equal highs were distribution, not consolidation, and the next directional move is likely lower.
This is the cleanest way to resolve the equal high ambiguity without predicting which way the market will resolve: observe the equal highs, note the behavior of the lows, monitor for a BOS above or a ChoCh below, and update the structural read accordingly.
Practical Checklist for Equal High / Equal Low Analysis
When you identify equal highs or equal lows on a chart, work through this sequence:
What are the lows doing? Rising, flat, or falling – this single observation narrows the structural interpretation significantly
What is the momentum of successive tests? Strengthening, consistent, or weakening – informs the likely resolution direction
What is the volume pattern across the tests? Expanding, compressing, or spiking on specific tests; also check whether heavy volume occurs on the approach to resistance or on the pullback
What is the higher timeframe context? Uptrend, downtrend, or range on the timeframe above – this determines whether equal highs are more likely to be consolidation or distribution
Wait for the BOS or ChoCh to resolve ambiguity – do not pre-empt the structural signal with a prediction
The Complete Structure Cluster
With this post, the six-part structure series is complete:
| Article | What It Covers |
|---|---|
| Higher highs and higher lows: market structure guide | Uptrend structure – HH and HL |
| Lower highs and lower lows: bearish structure explained | Downtrend structure – LH and LL |
| Range-bound trading strategy | Sideways structure – ranges and breakouts |
| Swing highs and swing lows explained | The foundational building blocks |
| Break of structure vs. change of character | How structural transitions are identified |
| This post | Equal highs and lows – the grey zone between trend and reversal |
Together these six posts cover every market state, every structural transition, and the most common ambiguity that falls between the clean categories. That is the complete structural framework.
Summary
Equal highs and equal lows sit in the grey zone between clear trending structure and range structure – and reading them correctly requires more context than reading a clean HH or LL. Here is the framework condensed:
Equal highs form in three contexts: consolidation before continuation (bullish), distribution at a peak (bearish), or as part of a fakeout setup
The most important differentiator is what the lows are doing while the highs are equal – rising lows signal compression, falling lows signal distribution, flat lows signal a range
Momentum and volume across successive tests add confirmation weight to the structural interpretation; to separate accumulation from distribution, note where heavy volume occurs (on the rally to resistance vs. on the pullback)
Higher timeframe context determines whether equal highs are likely consolidation or likely distribution
The ambiguity resolves through price action: a BOS above the equal highs confirms continuation, a ChoCh below the consolidation lows confirms distribution
The fakeout scenario (marginal new high followed by sharp reversal) is a ChoCh in disguise – the break below the prior swing low is the structural warning
The same framework applies symmetrically to equal lows in a downtrend
Markets spend more time in ambiguous structural states than in clean trending ones. The ability to read equal highs and equal lows with structural precision – rather than guessing at their meaning – is what makes the rest of the structural framework functional in real market conditions.
Frequently Asked Questions (FAQ)
Q: Are equal highs bullish or bearish?
A: Equal highs are neutral in isolation. Their meaning depends on the lows. If the lows are rising while highs stay equal, it is typically a bullish consolidation (accumulation). If the lows are falling or flat, it often signals distribution and a potential trend reversal.
Q: How do I tell a "Fakeout" from a genuine Higher High?
A: A genuine higher high is usually confirmed by a decisive candle close above the previous peak with expanding volume. A fakeout often features a marginal new high (often just a wick) followed by a sharp, high-momentum reversal that breaks the most recent swing low (a Change of Character).
Q: Why does volume matter when price hits equal highs?
A: Volume reveals the conviction behind the test. If volume is heavy on the rally to resistance but dries up on the pullback, demand is absorbing supply. However, if volume spikes on the pullback from the equal highs, it suggests aggressive selling (distribution).
Q: What is the "0.5–1% Rule" for equal highs?
A: Because markets aren't mathematically perfect, swing highs within a tight zone (usually 0.5–1% for stocks) are treated as "equal highs". The goal is to determine if the market has meaningfully exceeded the prior ceiling or if it is still stalling in the same resistance band.
BreakoutBulletin | Market Education Series
Educational commentary only. Not investment advice. Past performance does not guarantee future results.