
Earnings Analysis · The Trade Desk (TTD), Q2 2026
By Manish T. · BreakoutBulletin
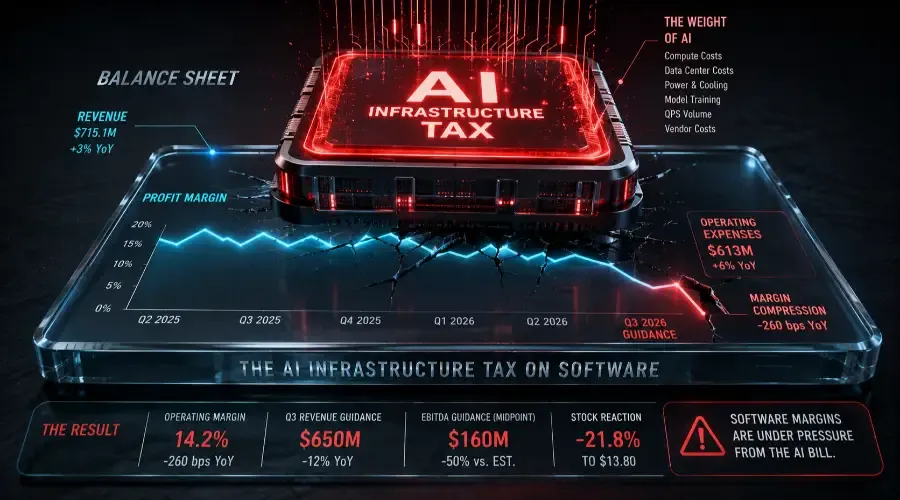
The Trade Desk grew its revenue 3% last quarter, and its stock plummeted ~22%. On the surface, that reaction looks like a routine earnings miss from a high-expectation name. But underneath sits a story bigger than one ad-tech company's soft quarter.
A premium growth stock decelerated from double-digit growth to 3% in a single quarter, guided the next quarter nearly 20% below expectations, and replaced three senior executives simultaneously. The most critical detail: company filings attribute higher operating costs to processing AI workloads and query-per-second (QPS) data-center activity. Software winners are starting to pay the AI-infrastructure tax, showing up plainly in a P&L statement.
What Actually Happened
- Top-Line Deceleration: Revenue of $715.1 million grew just 3% YoY, missing the $752.6 million consensus. This marks a dramatic slowdown from 12% growth in Q1 2026 and 18% in 2025.
- Operating Margin Compression: GAAP operating income fell to $102 million from $117 million a year ago. Operating margins compressed from 16.8% down to 14.2% as operating expenses grew 6% YoY to $613 million, significantly outrunning top-line expansion.
- Guidance Collapse: Management guided Q3 revenue to $650 million – a ~12% YoY decline – against analyst expectations of $804.8 million (a ~19% shortfall). Midpoint Q3 EBITDA guidance of $160 million missed expectations ($339.6 million) by over 50%.
- Market Re-Rating: Shares plunged 21.8% to $13.80, breaking well below previous 52-week lows.
The Tell: Three Executives Out in One Report
Alongside the miss, The Trade Desk replaced its chief financial officer, chief marketing officer, and commercial chief. Replacing three C-suite executives in a single earnings release is an admission that the shortfall is structural and execution-driven rather than purely a matter of macro demand. Analysts read the overhaul as confirmation of weak sales execution and market share loss to lower-priced programmatic rivals.
Quantifying the AI Infrastructure Tax
The core driver of margin compression was cost, not just demand. Filings directly attribute the 6% YoY increase in operating costs ($613 million total) to query-per-second (QPS) volume, AI model workloads (including its Kokai AI platform processing up to 13 million impressions/second), data-center capacity, and vendor usage.
Running an AI-heavy ad platform became materially more expensive. This is a clean example of the AI-infrastructure bill landing not on a hardware provider, but on an AI-software firm that the market assumed would be a margin beneficiary.
The cost pressure does not stop at cloud compute. AI infrastructure is also creating shortages in the supporting hardware stack, including power-management ICs, server components and specialized chips, which can raise the cost of deploying and operating additional compute capacity.
The Downstream Physical Constraint
Data-center costs squeezing TTD's margins are the downstream result of hardware bottlenecks:
- Tool Lead Times: Semiconductor fabrication equipment lead times remain stretched at 12+ months.
- Grid Bottlenecks: Power availability constraints and high-voltage transformer shortages are delaying new data-center deployments.
- Cost Transmission: Upstream HBM and AI accelerator cost inflation is passing directly into the operational cost of running real-time AI models.
The important point is that these are not isolated hardware issues. AI deployment is constrained by a broader physical stack spanning power, memory, advanced packaging, cooling and critical inputs, with a bottleneck at any one layer capable of raising the cost of the entire computing system.
Institutional Actionability Matrix
| Structural Theme | Mainstream Narrative | Institutional Take | Actionable Tickers |
|---|---|---|---|
| Software AI Margins | AI expands software gross margins | High compute/QPS costs compress margins as revenue growth decelerates | Short / Avoid: TTD and high-multiple AI software names with slowing growth |
| Infrastructure Providers | Data-center CapEx is overbuilt | Compute/QPS costs represent sticky, recurring top-line revenue | Long: EQIX, CEG, NVDA |
| Upstream Equipment | Cyclical vendor status | Absolute pricing power due to 12+ month delivery lead times | Long: ASML, AMAT, KLAC |
The Cross-Asset Signal
This cost pressure aligns with credit markets, where tech-heavy corporate debt spreads have widened alongside elevated hyperscaler bond yields. The ~22% stock drop occurred while the VIX hovered near 15, signaling a fundamental re-rating of AI software unit economics rather than broad macro noise.
The same economics matter on the infrastructure side, where hyperscalers and data-center operators are increasingly committing to long-duration capacity. 15-year data-center leases can lock in substantial fixed obligations, making the economics of AI infrastructure increasingly sensitive to utilization, power costs and the durability of compute demand.
Falsification Framework
The thesis that AI operational costs pose a structural threat to software margins weakens if:
- QPS Efficiency Gains: AI workload optimization lowers cost-per-query faster than query volumes expand.
- Revenue Re-acceleration: High-margin top-line growth accelerates enough to absorb data-center overhead.
- Power/Capacity Easing: Data-center capacity expansion accelerates, driving down compute hosting costs.
Related Reading
• The AI Boom Is Now Running on Debt, and the Bond Market Is Starting to Charge More
• The AI Build-Out's Deepest Bottleneck Isn't Chips or Memory. It's Getting Power to the Building.
• The Memory Shortage Behind the AI Boom: How HBM Demand Is Draining Conventional DRAM
Bottom Line: Watch the cost line, not just the top line. As the AI build-out matures, the infrastructure bill is migrating from chipmakers to software platforms.
Disclaimer
BreakoutBulletin publishes educational and analytical content only. Nothing here is investment, financial, legal, or tax advice, or a recommendation or solicitation to buy, sell, or hold any security. Figures are drawn from The Trade Desk's Q2 2026 earnings release, SEC filings, and public reporting as of the publication date, and may be revised. References to analyst ratings or price targets are reported as facts and are not endorsements. Past performance does not indicate future results. Readers should conduct their own research and consult a qualified, registered financial adviser before making any decision.