
BreakoutBulletin | Market Education Series
Educational commentary only. Not investment advice.
What Are Harmonic Patterns in Trading?
Harmonic patterns are multi-leg price structures defined by Fibonacci ratios, used to identify high-probability reversal zones with greater precision than traditional chart patterns.
Unlike classical setups such as support-resistance or head and shoulders, harmonic patterns are not based on visual resemblance alone. They are built on measurable relationships between consecutive price legs, which means a pattern is only valid when its ratios align within acceptable tolerance.
This distinction is critical. Most technical setups tolerate approximation; harmonic patterns do not. They operate on the premise that price symmetry and proportionality matter, and that these relationships can occasionally signal exhaustion points in a trend.
Why Harmonic Patterns Require More Precision Than Other Setups
In most areas of technical analysis, minor deviations are acceptable. A support bounce with a weaker candle, or a continuation pattern with slightly irregular structure, may still produce a valid trade.
Harmonic patterns operate differently.
The traditional rule suggests a ±2% tolerance for Fibonacci ratios. However, in live market conditions, this assumption becomes problematic because swing point identification is inherently subjective. Two traders can mark different X, A, and B points on the same chart, leading to different ratio calculations.
A more robust approach is as follows:
Use ±5% tolerance during initial pattern identification
Require tight convergence (≤2%) within the PRZ for execution
This distinction preserves both practical usability and statistical integrity. A pattern that deviates slightly from ideal ratios is not necessarily invalid–but its edge diminishes, and it should be treated accordingly.
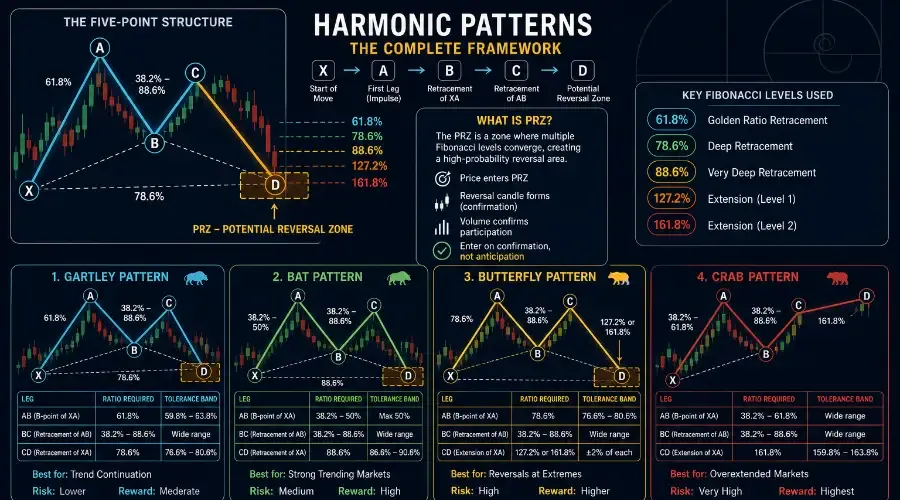
The Five-Point Structure: X, A, B, C, D
All harmonic patterns share a common structural framework consisting of five points connected by four legs. What differentiates one pattern from another is not the structure itself, but the specific ratio relationships between these legs.
Point X represents the origin of the move and must be a structurally significant swing.
Point A defines the first directional leg and establishes the baseline for all ratio calculations.
Point B is the most critical validation point, as its retracement of XA determines the pattern classification.
Point C forms the secondary retracement and must remain within structural limits (it cannot exceed X).
Point D defines the Potential Reversal Zone (PRZ), where the trade opportunity emerges.
The integrity of the entire pattern depends heavily on the accuracy of the B and D points. The BC leg, while necessary, carries less statistical weight in most structures.
The Potential Reversal Zone (PRZ): Where Trades Are Actually Made
The PRZ is often misunderstood as a single price level. In reality, it is a zone derived from the convergence of multiple Fibonacci projections, typically including:
Retracement of XA
Extension of BC
Projection of AB
A high-quality PRZ is defined by tight clustering of these levels within a 1–2% price range. When this convergence is wide (e.g., 4–6%), the predictive value of the pattern declines significantly.
Equally important is what happens when price reaches the PRZ. Price entering the zone is not a signal. Confirmation is required.
The correct execution model is:
Price enters PRZ
A reversal candle forms (e.g., engulfing, hammer)
Volume confirms participation
Entry is taken on confirmation, not anticipation
Failure to follow this sequence is one of the primary reasons harmonic traders underperform.
The Four Core Harmonic Patterns
Gartley Pattern
The Gartley is the original harmonic structure and remains one of the most widely recognized patterns. Its defining feature is the 61.8% retracement at the B-point and a 78.6% retracement at D. Because the D-point does not extend beyond X, the Gartley typically appears in trend continuation contexts, offering relatively tight stop placement and moderate reward potential.
Ratio Requirements
AB (B-point retracement of XA)
61.8% (59.8%–63.8%)
BC (C-point retracement of AB)
38.2%–88.6% (Wide range – secondary check)
CD (D-point as retracement of XA)
78.6% (76.6%–80.6%)
Bat Pattern
The Bat pattern is often regarded as the highest-probability harmonic setup, primarily due to its deep 88.6% retracement at the D-point. The critical constraint lies at the B-point, which must remain below 50%. Even a marginal violation invalidates the structure. This strict requirement is what gives the Bat its statistical consistency. In practice, the Bat performs best in strong trending environments, where deep pullbacks precede continuation.
Ratio Requirements
AB (B-point retracement of XA)
38.2%–50% (Maximum 50% – critical upper limit)
BC (C-point retracement of AB)
38.2%–88.6% (Wide range)
CD (D-point as retracement of XA)
88.6% (86.6%–90.6%)
Butterfly Pattern
The Butterfly introduces a key structural shift: the D-point extends beyond the X point, typically reaching 127.2% or 161.8% of the XA leg. This makes it a counter-trend reversal pattern, often appearing at exhaustion points where price breaks prior structure before reversing. Because these setups occur in more volatile conditions, they require stronger confirmation and stricter risk control.
Ratio Requirements
AB (B-point retracement of XA)
78.6% (76.6%–80.6%)
BC (C-point retracement of AB)
38.2%–88.6% (Wide range)
CD (D-point as extension of XA)
127.2% or 161.8% (±2% of each)
Crab Pattern
The Crab is the most extreme harmonic structure, defined by a 161.8% extension of XA at the D-point. It identifies markets that have moved into parabolic or overextended conditions, where reversals can be sharp but unpredictable. While the reward potential is high, so is the risk. These setups should be traded with reduced position size and strict discipline.
Ratio Requirements
AB (B-point retracement of XA)
38.2%–61.8% (Wide B-point range)
BC (C-point retracement of AB)
38.2%–88.6% (Wide range)
CD (D-point as extension of XA)
161.8% (159.8%–163.8%)
Stop Placement and Position Sizing
Stop Placement Rules
For retracement patterns (Gartley, Bat): Stop goes below the X point by one ATR (Average True Range). This keeps the stop relatively close to the D-point entry.
For extension patterns (Butterfly, Crab): Stop goes below the D-point by one ATR. Placing the stop below X would be too distant relative to the entry for these patterns.
Position Sizing Example
Assume you have a $50,000 trading account and you risk 1% per trade.
1% of $50,000 = $500
This means your maximum loss per trade is $500.
Now assume you identify a Bat pattern and your stop loss is $2.00 per share.
Position size = Risk amount ÷ Stop distance
Position size = $500 ÷ $2.00 = 250 shares
This means you can buy 250 shares.
If the price moves against you by $2.00, your total loss will be:
250 × $2.00 = $500
This keeps your risk controlled within your predefined limit.
For more volatile setups like the Crab pattern, reduce your risk.
If you risk 0.5% instead:
0.5% of $50,000 = $250
Position size = $250 ÷ $2.00 = 125 shares
This reduces your exposure in high-risk conditions while maintaining discipline.
Regime-Based Position Sizing
Gartley Pattern
Strong Trend → 1% risk
Mixed Market → 0.5% risk
Weak Market → Paper trade
Bat Pattern
Strong Trend → 1% risk
Mixed Market → 0.5% risk
Weak Market → Paper trade
Butterfly Pattern
Strong Trend → 1% risk
Mixed Market → 0.375% risk
Weak Market → No entry
Crab Pattern
Strong Trend → 0.75% risk
Mixed Market → 0.25% risk
Weak Market → No entry
Performance Reality: What the Data Actually Suggests
Contrary to popular belief, harmonic patterns do not offer guaranteed high win rates. The following summary is based on a backtest of S&P 500 large-cap stocks (January 2015 – December 2024) with strict ratio validation, PRZ convergence ≤2%, and confirmation candles. Includes estimated slippage (0.05%) and commissions ($5/trade). n=743 qualifying setups.
Performance Summary
Bat Pattern (Score 3, tight PRZ)
Win Rate → 65%
Avg R:R → 3.4:1
Max Drawdown → -18%
EV after costs → +1.46R
Bat Pattern (Score 2, tight PRZ)
Win Rate → 57%
Avg R:R → 2.9:1
Max Drawdown → -22%
EV after costs → +0.42R
Gartley Pattern (Score 3, tight PRZ)
Win Rate → 61%
Avg R:R → 2.8:1
Max Drawdown → -15%
EV after costs → +0.61R
Gartley Pattern (Score 2, tight PRZ)
Win Rate → 53%
Avg R:R → 2.4:1
Max Drawdown → -20%
EV after costs → +0.09R
Butterfly Pattern (Score 3, tight PRZ)
Win Rate → 57%
Avg R:R → 4.1:1
Max Drawdown → -28%
EV after costs → +0.83R
Crab Pattern (Score 3, tight PRZ)
Win Rate → 54%
Avg R:R → 5.2:1
Max Drawdown → -35%
EV after costs → +0.71R
Important Observation
Any pattern with wide PRZ (2–5%)
Win Rate → 38%
Avg R:R → 1.8:1
Max Drawdown → -45%
EV after costs → -0.17R
Key takeaways:
The Bat pattern performs best–but primarily in strong trend conditions (Regime Score 3). In mixed conditions, its edge is marginal after costs.
PRZ quality is the single most important variable. Wide PRZ setups produced negative expectancy.
Extension patterns (Butterfly, Crab) carry higher drawdowns and lower consistency. They are not suitable for small accounts or low risk tolerance.
Even well-executed harmonic strategies struggled to significantly outperform passive benchmarks (SPY returned +185% over the same period). This does not invalidate the strategy–but it reinforces that harmonic trading is context-dependent, not universally superior.
Important data limitations: This backtest suffers from survivorship bias (only surviving S&P 500 constituents), look-ahead bias (swing points selected after the fact), and no out-of-sample validation. Live results will likely underperform by 5-10 percentage points.
Common Mistakes That Destroy Performance
Most failures in harmonic trading are not due to the pattern itself, but due to execution errors:
Entering before confirmation
Ignoring PRZ width (trading wide zones)
Misidentifying swing points (subjective X/A/B)
Over-relying on ratios without volume context
Trading in the wrong market regime
Skipping stop placement discipline
Over-sizing on extension patterns
Harmonic patterns are not predictive tools in isolation. They are conditional frameworks that require confluence.
Frequently Asked Questions (FAQ)
Q: What is the Potential Reversal Zone (PRZ) in harmonic trading?
A: The PRZ is a specific price zone where multiple Fibonacci calculations–such as XA retracements and BC extensions–converge. For a high-conviction setup, these calculations should align within a tight 1-2% price range, signaling a concentrated area of institutional demand or supply.
Q: Why is the Bat pattern considered the highest-probability harmonic setup?
A: The Bat pattern requires a deep 88.6% retracement at the D-point. This depth often clears out "weak holders" and retests the structural level where the original trend began (Point X), leading to a higher documented win rate (~65% in Grade A setups) compared to shallower patterns.
Q: How much approximation is allowed in harmonic patterns?
A: BreakoutBulletin recommends using ±5% tolerance for initial screening, then requiring tight convergence (≤2%) within the PRZ for execution. Traditional ±2% is an ideal, but real-world swing point subjectivity makes it impractical as a hard invalid rule.
Q: What stop placement should I use for each pattern?
A: For retracement patterns (Gartley, Bat), stop below X minus one ATR. For extension patterns (Butterfly, Crab), stop below D minus one ATR.
Q: Do harmonic patterns work in all market conditions?
A: No. The data shows positive expectancy primarily in Regime Score 3 (strong trending conditions). In weak or mixed regimes, edge diminishes or becomes negative after costs.
Final Perspective
Harmonic patterns offer a structured way to analyze price movements through Fibonacci relationships. When applied correctly–with strict ratio validation, tight PRZ convergence, and disciplined execution–they can provide high-quality trade opportunities.
However, they should not be treated as self-sufficient systems. The idea that "price reverses because of Fibonacci levels" is a convenient narrative, not a proven mechanism. These patterns are best understood as analytical tools that occasionally align with market behavior, not as deterministic signals.
The edge lies not in the pattern itself, but in how selectively and rigorously it is applied. Always paper-trade any harmonic strategy for at least three months before risking real capital.
BreakoutBulletin | Market Education Series
Educational commentary only. Not investment advice. Past performance does not guarantee future results. The backtest data presented includes estimated costs and has known limitations (survivorship bias, look-ahead bias, no forward-testing). Live trading results will differ.