
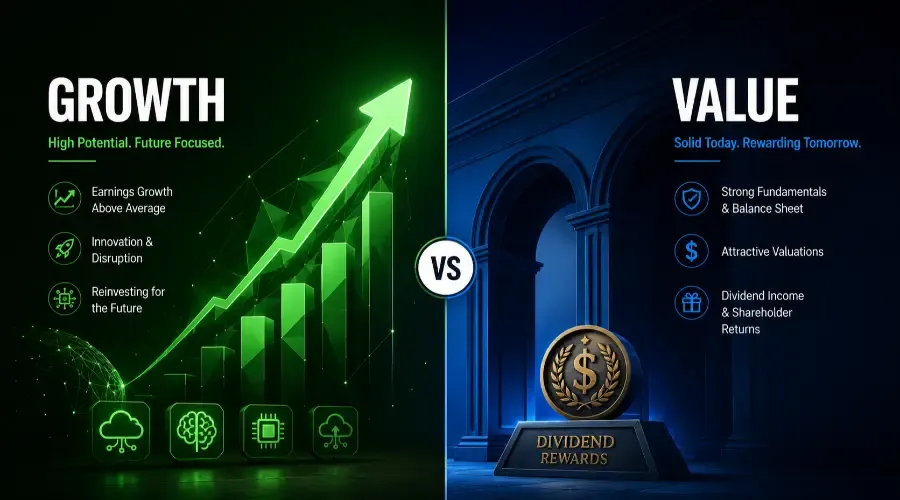
Two broad investing styles have dominated financial literature for decades: growth and value. They reflect different theories about where stock returns come from and different tolerance levels for volatility. Understanding both helps you build a portfolio aligned with your actual goals rather than defaulting to whatever is currently getting attention.
Growth Stocks
Growth stocks are companies expected to increase revenue and earnings faster than the market average. Investors pay a premium for that expected future performance – which is why growth stocks typically trade at high price-to-earnings ratios. A company reporting thin or no current profits but growing revenue 40% annually can still command a high valuation if investors believe the future earnings will justify it.
Technology, consumer discretionary, and healthcare innovation dominate the growth category. Nvidia, Shopify, Chipotle, Lululemon, and Moderna are examples of companies that have carried growth-stock characteristics at different points in their development.
The trade-off is volatility. Growth stocks are priced on expectations. When those expectations disappoint – slower revenue growth, a missed earnings estimate, or rising interest rates that reduce the present value of distant future earnings – prices can fall sharply. Tesla's share price declined approximately 70% from its 2021 peak to its 2022 low. Investors who bought near the peak and sold near the low experienced a significant loss. Investors who held through the decline recovered over the following two years.
Value Stocks
Value stocks are companies trading at a discount to what analysis suggests they're worth. The discount may reflect temporary business difficulties, unfashionable industries, or markets overreacting to negative news. Value investors buy those stocks expecting the gap between price and intrinsic worth to close over time.
Value stocks tend to trade at lower P/E ratios, pay higher dividends, and operate in less exciting sectors – financials, energy, consumer staples, utilities, industrials. Coca-Cola, JPMorgan Chase, ExxonMobil, and Procter & Gamble have historically carried value stock characteristics.
The return profile is more measured. Value stocks don't typically produce multi-year gains of 200% to 500%. They produce steady appreciation – often 8 to 12% annually – supplemented by dividend income. In market downturns, value stocks tend to hold their price better because their valuations weren't stretched to begin with.
Historical Return Comparison
Over 30 years through 2024, growth stocks returned approximately 10.8% annually while value stocks returned approximately 9.1%. The 1.7 percentage point gap compounds significantly: $10,000 in growth at 10.8% over 30 years grows to approximately $213,000; at 9.1%, the same amount reaches approximately $147,000.
The comparison is not static. Over certain decades, value significantly outperformed growth – the 2000 to 2010 period saw value stocks generate modest positive returns while growth stocks (dominated by overvalued dot-com companies) declined substantially. From 2010 through 2021, growth dramatically outperformed as technology companies expanded. From 2022 onward, the relationship shifted again as interest rates rose.
Neither style wins in every environment. Holding both reduces the risk that your timing coincides with the underperforming decade for whichever you chose exclusively.
How Interest Rates Affect Each
Growth stocks are more sensitive to interest rate changes. Higher rates reduce the present value of future earnings, which disproportionately impacts companies whose value is concentrated in distant future cash flows. Value stocks, with stronger near-term earnings and dividend income, are less affected.
When rates rise – as they did sharply in 2022 – growth stocks typically sell off more than value stocks. When rates fall, growth stocks tend to recover faster. This dynamic explains much of the rotation between growth and value that market observers discuss during rate cycles.
ETF Options
Growth exposure: VUG (Vanguard Growth ETF), SCHG (Schwab U.S. Large-Cap Growth ETF), QQQ (NASDAQ-100, technology-heavy)
Value exposure: VTV (Vanguard Value ETF), SCHD (Schwab U.S. Dividend Equity ETF), VYM (Vanguard High Dividend Yield ETF)
Blended exposure: VOO or VTI (total market) naturally holds both growth and value companies in proportion to their market caps.
Calibrating the Mix
For an investor with a 20-plus-year time horizon who can tolerate meaningful short-term drawdowns, a growth-leaning allocation – 70 to 80% growth, 20 to 30% value – has historically aligned with the objective of maximizing long-term wealth accumulation.
For an investor with a shorter time horizon, higher sensitivity to drawdowns, or an interest in dividend income, a more balanced or value-leaning allocation provides steadier results with less potential for a single bad year to derail the plan.
The proportion matters less than consistency. Shifting between growth and value in response to short-term market moves – performance chasing – typically produces worse outcomes than holding a fixed allocation through multiple market cycles.
This content is for educational purposes only and does not constitute investment, legal, or tax advice. Investing in securities involves risk, including possible loss of principal. Always conduct your own research and consult a licensed financial professional before making investment decisions.
The growth-vs-value distinction explains a lot of the rotation you'll read about in market coverage - especially during rate cycles. Understanding how interest rates affect each style makes that coverage clearer.
→ Stock Categories and Types → The full categorisation framework including market cap and share class - www.breakoutbulletin.com/article/stock-categories-market-cap-growth-value
→ What Is Market Capitalization? → How company size interacts with growth and value characteristics - www.breakoutbulletin.com/article/what-is-market-capitalization-for-teens
→ NASDAQ Composite Explained → Why the NASDAQ - heavily weighted to growth stocks - moves more than the S&P 500 - www.breakoutbulletin.com/article/nasdaq-composite-for-teens