
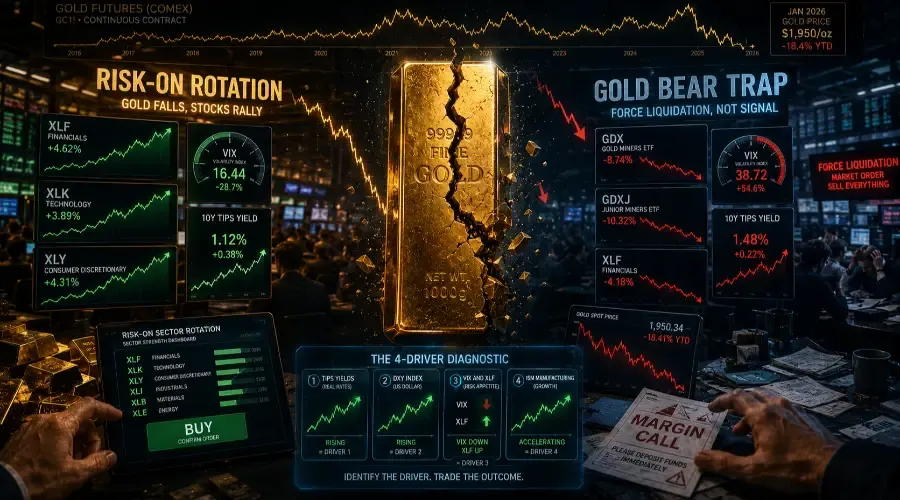
Falling gold prices aren’t automatically bearish. The signal depends entirely on why gold is falling – and whether real rates, the dollar, safe-haven demand, or growth expectations are behind the move. In this gold price decline analysis, you’ll learn a 4-driver framework that separates a bullish risk-on rotation from a genuine gold bear market, and why the GDX falling / XLF rising pair trade is one of the cleanest sector setups available.
J.P. Morgan's global research desk and Investopedia both explain falling gold the same way: rising real rates, a strengthening dollar, central bank policy shifts, and unwinding safe-haven demand. Every explanation is technically correct, and none of them tells you what to actually do with your portfolio when gold starts falling. The reason is that gold falling is not one signal – it is four completely different signals wearing the same price tag. Gold fell 30% in 2013 because the Fed hinted at tapering. Gold fell 25% in weeks during 2008's acute crisis phase. Gold fell 20% through 2022 despite 9% inflation. Three different falls, three different sector rotation outcomes – and in one of those three cases, falling gold was among the most bullish signals equity investors could have received. This post gives you the framework to tell them apart.
Why This Matters More Than Most Traders Realize
Gold falling is the most misread macro signal in retail trading. The instinctive response – "gold is falling, markets must be stressed, rotate defensive" – is accurate in exactly one of the four driver scenarios and completely wrong in the other three. A trader who applies that response mechanically across all gold decline scenarios will be defensive during risk-on rallies, miss cyclical recovery trades, and chronically underperform during exactly the environments where the most money is made.
The core insight: gold's price is set by the intersection of real interest rates, the US dollar, risk appetite, and structural demand. When gold falls, one or more of those inputs has shifted – and each shift produces a different equity market environment. The sectors that win and lose are entirely determined by which input changed, not by the fact that gold fell.
The quantitative stakes: GDX – the gold miners ETF – is among the highest-volatility equity instruments available to retail investors. In a sustained gold bear market, GDX can fall 50–70% from peak to trough. In a risk-on gold decline where crisis premiums unwind, XLF and XLK can simultaneously gain 20–40%. Getting the driver wrong means being short GDX while also missing the equity rally – a double error on both the defensive and the offensive side of the portfolio. [LINK: Precious Metals Hub]
What This Is Really Saying: The Four-Driver Diagnostic
Before determining what falling gold means for equity sectors, you must diagnose which of the four drivers is causing the decline. This diagnostic step is the entire analytical value-add of this post – and it is entirely absent from every competing analysis.
Driver 1: Rising Real Interest Rates.
When TIPS yields rise – the 10-year real rate moving from negative toward zero, or from zero toward positive – gold falls because the opportunity cost of holding a non-yielding asset increases. This driver is the most fundamentally bearish for gold and the most nuanced for equities: rising real rates are bad for XLRE, XLU, and XLK (rate-sensitive sectors) but simultaneously good for XLF (net interest margin expansion). The equity market environment in a rising-real-rate gold decline is mixed and sector-dependent, not broadly bearish.
Driver 2: US Dollar Strengthening.
A rising DXY mechanically reduces the dollar price of gold and all commodities. Gold falls not because of any change in real rates or risk appetite but because the measurement currency appreciated. This driver is bearish for GDX, XLE, and XLB broadly – the commodity complex falls with gold. But US domestic sectors insulated from currency moves – utilities, domestic consumer staples, regional banks – are relatively unaffected. The equity market environment in a dollar-strength gold decline is mixed: global and commodity-linked sectors underperform, domestic sectors are approximately neutral.
Driver 3: Risk-On / Crisis Premium Unwinding.
When gold falls because a geopolitical crisis has resolved, financial stress has normalised, or risk appetite has recovered, the gold decline is the most bullish signal in the macro toolkit. The safe-haven premium that was built into gold – representing the insurance value investors placed on crisis protection – is being released back into risk assets. XLF recovers as credit quality concerns ease. XLK rallies as growth expectations recover. XLY improves as consumer confidence returns. The equity market environment in a risk-on gold decline is broadly bullish, and defensive positions built during the crisis period should be reduced.
Driver 4: Growth Acceleration.
When real economic growth accelerates – GDP beats, manufacturing PMI surges, capex cycles expand – the opportunity cost of holding gold rises because productive assets (equities, real estate, infrastructure) are generating returns that gold cannot match. Gold falls not from fear but from the attractiveness of alternatives. This driver produces the broadest equity bull market of the four scenarios: cyclicals lead (XLI, XLY, XLB), financials benefit (credit quality improves with growth), and defensives underperform as capital rotates to higher-return opportunities.
The diagnostic test: Check TIPS yields (rising = Driver 1). Check DXY (rising = Driver 2). Check VIX and XLF relative performance (VIX falling, XLF recovering = Driver 3). Check ISM Manufacturing and durable goods orders (accelerating = Driver 4). Multiple drivers can be active simultaneously – the 2013 Taper Tantrum combined Drivers 1 and 3 as the removal of crisis-era policy simultaneously raised real rates and signalled a healthier economy.
The Lead/Lag Map: What Falling Gold Predicts and When
0–4 weeks after gold begins a sustained decline:
GDX and GDXJ fall immediately and sharply – the most reliable and driver-independent signal in a gold decline. Gold mining economics deteriorate mathematically with the gold price, and mining stocks re-rate within days. XLB falls modestly as gold producers drag the broader materials index lower. This is the one signal that does not require driver identification – GDX is a sell under every falling gold scenario.
XLF behaviour in the first four weeks is the most important diagnostic indicator: if XLF is rising while gold falls, Driver 3 (risk-on) or Driver 1 (real rates) is active. If XLF is also falling while gold falls, dollar strength (Driver 2) is likely dominant.
1–3 months:
Driver 1 (rising real rates): XLRE and XLU begin underperforming as discount rates rise. XLK faces multiple compression. XLF outperforms as NIM expansion thesis builds.
Driver 2 (dollar strength): XLE and XLB continue declining. Multinational XLK and XLV report currency headwinds in earnings calls. Domestic-focused sectors hold up relatively.
Driver 3 (risk-on): XLK leads the recovery rally. XLY improves as consumer confidence recovers. XLP and XLU give back their defensive premium as capital rotates to growth.
Driver 4 (growth acceleration): XLI and XLY lead. XLB recovers as industrial demand rises. XLF benefits from credit quality improvement. The broad equity market advances.
3–6 months:
Regardless of driver, if gold has declined more than 20% from a prior peak and held that level for eight or more weeks, the gold bull market thesis is likely impaired. GDX typically produces the largest losses in this window as institutional investors exit positions and hedge funds unwind long gold allocations. Central bank demand data (quarterly, World Gold Council) becomes the key variable for whether the structural floor under gold holds or breaks.
Sector Rotation Sequence: Who Benefits and In What Order
Materials (XLB / GDX) – Strong Negative – Immediate (All Drivers).
GDX and GDXJ fall under every falling gold scenario – they are the only sector call that does not require driver identification. Gold miners' operating leverage works in both directions: a 15% gold price decline produces a 30–45% decline in mining company earnings per the same operating leverage that made them attractive in a bull market. Selling or underweighting GDX is the first action in any confirmed gold decline, sized before driver identification is complete.
Energy (XLE) – Moderate Negative – Immediate (Driver 2 Only).
When dollar strength is the active driver, XLE falls with gold as the dollar appreciation compresses all commodity prices simultaneously. In Driver 1 (real rates) and Driver 3 (risk-on), XLE is approximately neutral to mildly positive as the growth outlook is not impaired. In Driver 4 (growth), XLE can be a strong positive. Driver identification is essential before making an XLE call on a gold decline.
Industrials (XLI) – Positive – 1–3 Months (Drivers 3 and 4).
Risk-on recovery and growth acceleration both produce XLI outperformance. Capital goods ordering accelerates when growth expectations improve and crisis premiums unwind. In Driver 1 (real rates rising), XLI faces a capex financing cost headwind that partially offsets the growth positive. In Driver 2 (dollar strength), export-oriented XLI companies face competitiveness headwinds. Expect 3–6% relative outperformance in Driver 3 and Driver 4 scenarios.
Utilities (XLU) – Mixed – Immediate (Driver Dependent).
Driver 1 (rising real rates): XLU falls significantly – the bond-proxy discount rate mechanism operates identically whether rates rise from a gold-bull unwinding or from any other source. Driver 3 (risk-on): XLU gives back its defensive premium as capital rotates to cyclicals, falling 2–4% on a relative basis. Driver 4 (growth): XLU underperforms cyclicals but faces no fundamental headwind. XLU is the most driver-sensitive sector in a gold decline.
Real Estate (XLRE) – Negative (Driver 1) / Neutral (Others) – 1–3 Months.
Rising real rates are the most direct headwind for XLRE – the same mechanism that drove XLRE higher when real rates were negative now reverses. In risk-on and growth scenarios, XLRE is approximately neutral to mildly positive as the economic backdrop improves without the rate headwind. Expect 3–5% relative underperformance in Driver 1 scenarios; near-neutral in Driver 3 and Driver 4.
Technology (XLK) – Mixed – 1–3 Months.
Driver 1 (rising real rates): XLK faces multiple compression from higher discount rates – the same mechanism that made XLK attractive in the negative-real-rate gold bull now reverses. Driver 3 (risk-on): XLK leads the recovery as growth expectations recover. Driver 4 (growth): XLK benefits from both the growth acceleration and improving enterprise spending. Driver 2 (dollar strength): multinational XLK companies face currency headwinds. XLK is a buy in Drivers 3 and 4, a sell in Driver 1.
Consumer Discretionary (XLY) – Positive – 1–3 Months (Drivers 3 and 4).
Risk-on and growth acceleration both produce XLY outperformance as consumer confidence improves and discretionary spending recovers. In Driver 1 (rising real rates), XLY faces mortgage and auto loan cost headwinds that partially offset the growth positive. Expect 3–5% relative outperformance in Driver 3 and Driver 4 scenarios.
Consumer Staples (XLP) – Mild Negative Relative – 1–3 Months (Drivers 3 and 4).
As crisis premiums unwind and growth accelerates, XLP gives back its defensive premium. Capital that rotated into XLP during the gold spike phase now rotates into cyclicals. The absolute XLP return may be flat to mildly positive, but relative to the equity market it underperforms. Expect 2–3% relative underperformance in risk-on and growth scenarios.
Communication Services (XLC) – Positive – 1–3 Months (Drivers 3 and 4).
Ad budget expansion accompanies consumer confidence recovery and corporate revenue improvement. XLC recovers as the growth and risk-on thesis validates. Expect 2–4% relative outperformance in Driver 3 and Driver 4 scenarios.
Healthcare (XLV) – Mild Negative Relative – 1–3 Months (Drivers 3 and 4).
Healthcare gives back its defensive premium as capital rotates to cyclicals, but the absolute defensive characteristics of healthcare revenue mean the relative underperformance is modest. Expect 1–2% relative underperformance versus the broader market as the defensive rotation reverses.
Financials (XLF) – Significant Positive – Immediate (Drivers 1 and 3).
This is the mirror of the gold-spike XLF negative call and the most important sector signal in a gold decline. Driver 1 (rising real rates): XLF benefits from NIM expansion – banks earn more on loans as rates rise. Driver 3 (risk-on): XLF recovers as credit quality concerns ease, financial stress indicators normalise, and risk appetite returns to financial assets. Under both drivers, XLF is the strongest relative performer in the equity market when gold is falling. This is the core pair trade: sell GDX, buy XLF – reversed from the gold spike playbook.
Historical Cases That Confirm the Pattern – Focus on the Early Signal
2008 | Force Liquidation Gold Crash – The False Signal Case
Gold fell nearly 25% from its March 2008 high of 1,011 to approximately 740 by October 2008 – during the worst financial crisis since the Great Depression. Every naive interpretation of the falling-gold framework would suggest this was a bullish signal: Driver 3 (risk-on) or Driver 4 (growth acceleration). It was neither. The 2008 gold decline was a force liquidation event – hedge funds and leveraged investors selling gold to meet margin calls and redemption requests, not because the crisis premium was resolving. XLF did not recover alongside falling gold; it collapsed. XLK did not rally; it fell. The gold decline and the equity market decline occurred simultaneously, powered by the same deleveraging force that was selling everything. This case is the definitive illustration of why price alone is insufficient – gold falling and XLF simultaneously falling confirms force liquidation, not risk-on. Gold subsequently recovered from 740 in October 2008 to 1,226 by December 2009 – validating that the 2008 fall was a temporary forced-selling event, not a trend change. Lag window: force liquidation gold fall and equity market fall simultaneous; gold recovery began within three months of the equity market low.
2013 | The Taper Tantrum – Driver 1 and 3 Combined
When Fed Chair Bernanke hinted at tapering QE in May 2013, gold fell from approximately 1,600 to 1,180 by June – a 26% decline in six weeks. This was the cleanest modern case of Driver 1 (rising real rates) combined with Driver 3 (risk-on as the crisis-era policy was deemed no longer necessary). TIPS yields spiked dramatically – rising from deeply negative to near zero – as the market repriced the forward interest rate path. GDX fell over 50% from its 2012 peak to its 2013 trough. But the equity market told the other side of the story: the S&P 500 rose 15% in H1 2013 as the Taper Tantrum played out in the gold and bond markets. XLF outperformed as NIM expansion expectations built. XLK continued rising as the technology earnings cycle was strong. XLY benefited from the improving economic confidence that underpinned the tapering discussion in the first place. The signal gold was sending in 2013 – crisis-era policy is no longer needed, real growth is recovering – was among the most bullish signals equity investors received that decade. Lag window: GDX fell immediately from the May 2013 announcement; XLF and XLK outperformed within weeks; equity bull market continued for six more years.
2022 | The Inflation Paradox – Driver 1 Dominant
Gold fell from its March 2022 high near 2,050 to below 1,620 by September 2022 – a 21% decline during the period of the highest US inflation in forty years. The driver was entirely real rates: the Fed's aggressive hiking cycle was raising nominal rates faster than already-high inflation, pushing TIPS yields from deeply negative to positive territory for the first time since 2018. GDX fell over 40% from peak to trough. XLRE fell sharply as mortgage rates doubled. XLK fell 33% on multiple compression. XLU underperformed despite its defensive characteristics because rising rates overwhelmed the defensive premium. XLF was the primary relative winner – regional and large-cap banks outperformed as the steepening rate environment initially supported NIM expansion before credit concerns emerged in H2. This case confirms the 2022 paradox described in the gold spike post: gold fell during high inflation, and the sector that won from falling gold (XLF) was not an obvious inflation beneficiary. Driver identification was the entire analytical edge. Lag window: GDX fell immediately from March 2022; XLF outperformed in H1 2022; XLRE and XLK underperformed throughout; gold bottomed coincident with the Fed's first pivot signals in Q4 2022.
The False Signal Trap: When to Ignore the Gold Decline
Gold produces three categories of false decline signals that should not trigger sector rotation responses:
Force Liquidation Declines.
When financial markets are in acute stress – the Lehman phase of 2008, the COVID crash of March 2020 – leveraged investors are forced to sell all liquid assets including gold to meet margin calls and redemptions. Gold falls not because the crisis premium is resolving but because forced selling overwhelms safe-haven buying. The diagnostic: XLF should be recovering if the decline is genuine risk-on. If XLF and gold are both falling simultaneously, force liquidation is likely, not risk-on. Wait for XLF stabilisation before acting on the falling gold signal.
Seasonal and Technical Corrections.
Gold has documented seasonal patterns – typically softer in spring and early summer as jewellery demand seasonality eases and investor positioning adjusts. A 5–8% gold decline over six to eight weeks during March to June can represent a technical correction within an ongoing bull market rather than a driver change. The filter: require the gold decline to exceed 10% from a recent high AND hold below a meaningful technical level (prior six-month low or 200-day moving average) for at least fifteen trading days before treating it as a signal.
Central Bank Selling Announcements.
Periodic central bank gold sales – such as the IMF sales program in 2009–2010 or European central bank sales in the early 2000s – can depress gold prices temporarily without any change in the fundamental driver environment. These are supply-side events that suppress price without changing the real rate, dollar, or risk appetite conditions that determine the actual investment signal. The filter: cross-reference any gold decline with central bank and IMF gold transaction disclosures. A decline accompanied by a known large institutional seller is not a signal-bearing event.
The Minimum Confirmation Standard:
Before acting on a falling gold signal with sector rotation, require a gold decline exceeding 10% from a recent high, held for fifteen or more trading days, accompanied by at least one driver confirmation (TIPS yield rising, DXY strengthening, VIX falling with XLF recovering, or ISM manufacturing accelerating).
The Trading Playbook
Before: What to Watch for Early Warning
Monitor the 10-year TIPS real yield daily (fiscaldata.treasury.gov, updated at 3pm EST). TIPS turning from negative to zero, or from zero toward positive – a rate of change move rather than an absolute level – is the earliest signal that the real rate driver is activating. When TIPS move more than 25 basis points higher over three consecutive weeks, the gold bull's fundamental support is weakening and GDX underperformance is historically reliable within two to four weeks.
Watch the GDX/gold ratio weekly (GDX divided by GLD on any charting platform). When GDX begins underperforming gold spot – the ratio falling – institutional selling of miners is leading the gold price lower. This ratio often turns before the gold spot price itself makes new lows, giving you a three to five week warning that the gold complex is under institutional distribution. A GDX/gold ratio declining for four or more consecutive weeks while gold spot is flat or mildly declining confirms that smart money is exiting mining exposure ahead of a larger gold price move.
Track VIX alongside XLF relative performance weekly. The VIX-XLF pair is the most reliable driver diagnostic available without access to institutional flow data. VIX falling and XLF rising simultaneously while gold declines = Driver 3 (risk-on) confirmed. VIX stable and XLF rising while gold falls = Driver 1 (real rates) confirmed. VIX stable and XLF falling while gold falls = Driver 2 (dollar strength) likely. This three-variable check takes less than two minutes and determines which sector rotation playbook you activate.
During: Positioning When Gold Is Falling
Sell GDX immediately on confirmation of a sustained decline below the 200-day moving average, regardless of driver. GDX is the one position that does not require driver identification – it underperforms under every falling gold scenario. Size the exit fully; do not attempt to hold partial GDX positions during a confirmed gold decline on the basis that "miners look cheap." Operating leverage that works in your favour in a bull market works against you proportionally in a bear market.
Buy XLF as the primary pair trade against the GDX exit. The GDX sell / XLF buy is the core falling-gold pair trade and works under two of the four drivers (real rates and risk-on). It is approximately neutral under the other two drivers, making it the highest-probability secondary rotation in a confirmed gold decline. Use the Financial Select Sector SPDR (XLF) for broad exposure, or overweight the large-cap diversified bank sub-sector within XLF if the driver is real rates (where NIM expansion benefits the largest balance sheet banks most).
Apply driver-specific secondary rotations after the GDX/XLF core trade is in place. Driver 1 confirmation (TIPS rising): add XLF, reduce XLRE and XLU. Driver 3 confirmation (VIX falling, XLF recovering): add XLK and XLY, reduce XLP and XLU defensive overweights. Driver 4 confirmation (ISM accelerating): add XLI and XLB industrial names, reduce all defensive positions. Driver 2 confirmation (DXY rising): add domestic-only names within XLU and XLP, reduce XLE and multinational XLK.
After: Reading the Recovery Signal in Gold
Watch for GDX making a higher low on a subsequent gold price test of the recent low – a sign that selling pressure is exhausting and the next move will be higher. GDX making a higher low while gold makes a lower low (positive divergence) is one of the most reliable reversal signals in the gold mining sector and has preceded major GDX recovery rallies in 2001, 2008, 2016, and 2018.
Monitor TIPS yields for a plateau and reversal below +0.5% as the signal that the real rate headwind for gold is peaking. When TIPS yields stop rising and begin consolidating – even before they fall – the Driver 1 headwind for gold is fading and the risk-reward for rebuilding GDX improves. Begin scaling back into GDX when TIPS yields have been range-bound for four or more weeks.
Reverse the XLF overweight back toward benchmark when VIX rises above 20 or when bank loan loss provisioning language begins appearing in XLF earnings calls – signals that the credit quality improvement from the risk-on phase is maturing and the NIM expansion benefit from rising rates is being offset by deteriorating credit quality. The XLF trade in a falling gold environment has a defined lifespan; it ends when either rates stop rising or credit quality starts deteriorating.
The 3 Mistakes Most Retail Traders Make
Mistake 1: Treating Every Gold Decline as Bearish for Equities
The most expensive mistake is seeing gold fall and reflexively adding defensive positions or reducing equity exposure. This error costs maximum return in Driver 3 and Driver 4 scenarios – precisely the environments where the most money is made in risk assets. In 2013, gold fell 26% in six weeks while the S&P 500 rose 15% in the same period. Traders who reduced equity exposure because gold was falling missed one of the strongest six-week equity rallies of the decade. The correct approach is to check the VIX-XLF diagnostic before making any equity allocation change based on falling gold. If XLF is recovering, reduce defensive positions rather than adding them.
Mistake 2: Confusing Force Liquidation Falls for Signal-Bearing Declines
The second mistake is acting on gold declines that occur during acute financial market stress – the March 2020 COVID crash, the September-October 2008 Lehman phase, the March 2023 banking stress episode. In these episodes, gold falls not because risk appetite is recovering or real rates are rising, but because leveraged holders are forced to sell to meet redemptions. The gold decline carries zero signal content about the economic or policy environment. Traders who see "gold falling = risk-on" and buy cyclicals during a force liquidation event are buying into a waterfall decline. The diagnostic is simple: if XLF is falling while gold is falling, force liquidation is active and the signal framework does not apply. Wait for XLF stabilisation.
Mistake 3: Ignoring the GDX Asymmetry on the Way Down
The third mistake is holding GDX during a confirmed gold decline because "miners look cheap on a P/NAV basis." The operating leverage that makes GDX attractive in a gold bull market is indifferent to valuation during a gold bear market. A miner that looks cheap at 1,800 gold looks cheaper at 1,600 gold and cheaper still at $1,400 gold – and the stock has declined proportionally at each level regardless of any fundamental value argument. The time to evaluate miner valuations on a P/NAV basis is after a 40–50% GDX decline from peak, not during the first 15%. Institutional investors with the patience and capital to average into GDX during a bear market do so after extended declines, not at the beginning of them.
Bottom Line: The One-Sentence Institutional Framework
When gold falls, sell GDX immediately regardless of driver, run the VIX-XLF-TIPS diagnostic to identify which of the four drivers is active, then buy XLF as the universal pair trade and add driver-specific rotations – risk-on means buy XLK and XLY; rising real rates means add XLF and reduce XLRE; growth acceleration means buy XLI and XLB; dollar strength means stay domestic.
This framework works across cycles because the inverse of every gold spike driver is structurally consistent: when real rates fall, gold rises and rate-sensitive sectors benefit; when real rates rise, gold falls and XLF benefits from NIM expansion. When crisis premiums build, gold rises and risk assets fall; when they unwind, gold falls and risk assets recover. The directions are mirror images of the gold spike playbook – but only if you have correctly identified the driver.
The retail edge is the diagnostic discipline to check three data points – TIPS yields, VIX, XLF – before acting on a gold decline signal. That three-variable check takes two minutes and separates the correct sector rotation from four different wrong answers.
Run this scenario through the [Breakout Bulletin Ripple Engine](LINK: Ripple Engine Tool) to compare the sector transmission map for falling gold against the gold spike map and see how each of the four driver scenarios produces a different winner-and-loser sequence across all twelve sectors.
Frequently Asked Questions
Why do gold prices fall?
Gold prices usually fall because real interest rates rise, the US dollar strengthens, safe-haven demand fades, or economic growth accelerates.
Is falling gold bullish for stocks?
Sometimes. If gold falls because crisis fears are fading or economic growth is improving, equities – especially Financials (XLF), Technology (XLK), and Consumer Discretionary (XLY) – can rally strongly.
Why does GDX fall harder than gold itself?
Gold miners have operational leverage. When gold prices fall, mining profits compress much faster than the gold price decline, causing GDX to underperform.
Why does XLF often rise when gold falls?
Falling gold driven by rising real rates or improving financial conditions often benefits banks through higher net interest margins and improving credit quality.
What is the relationship between TIPS yields and gold?
Gold usually falls when TIPS yields rise because higher real interest rates increase the opportunity cost of holding non-yielding gold.
Why did gold fall during high inflation in 2022?
Gold fell in 2022 because the Federal Reserve raised interest rates aggressively, causing real interest rates to rise even while inflation remained high.
What sectors benefit from falling gold prices?
Financials (XLF), Industrials (XLI), Technology (XLK), and Consumer Discretionary (XLY) often benefit depending on the driver behind the gold decline.
What is the difference between GDX and GLD?
GLD tracks physical gold prices directly, while GDX holds gold mining companies that provide leveraged exposure to gold price movements.
This post is part of the BreakoutBulletin "What Happens When" series. [LINK: Precious Metals Hub] · [LINK: Series Pillar Page]
Educational content only. Not investment advice. Past sector performance patterns do not guarantee future results.