
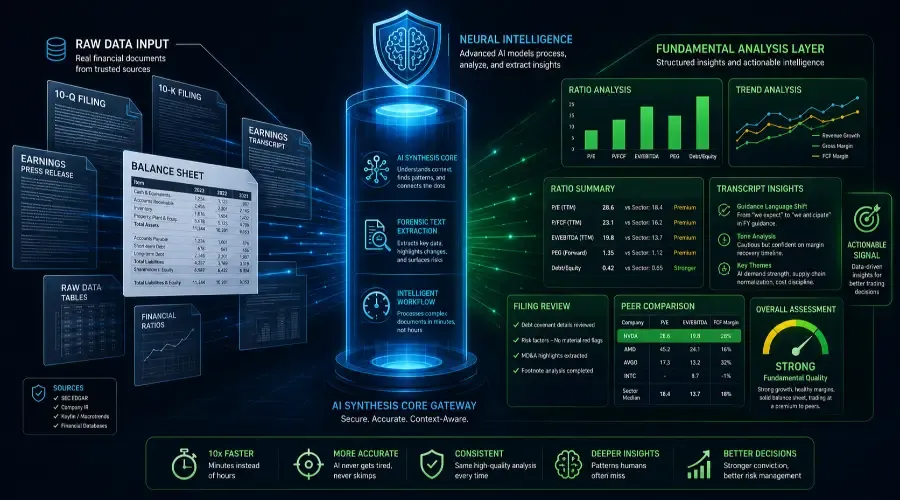
Traders who skip fundamental research entirely rely on price action and technical setups without understanding the business behind the stock. That works – until it doesn't. A technically perfect breakout in a company with deteriorating margins, a rising debt load, and management quietly walking back guidance can reverse violently on the next earnings release while the technical trader holds a position they don't understand.
Traders who try to go deep manually hit a different problem: time. A proper fundamental analysis of a single company – reading the 10-Q, working through the financial statements, listening to the earnings call, comparing ratios against peers – takes three to four hours done properly. Most retail traders don't have three to four hours per stock. So they read a summary, form a shallow view, and convince themselves they've done the work.
AI solves the speed problem. Not the judgment problem – that still belongs to you. But the processing bottleneck that turns a thorough fundamental analysis from a three-hour session into a 35-minute one is exactly where AI earns its place in a trading workflow.
This post covers how to use AI across every major fundamental research task – screening, ratio analysis, earnings transcript extraction, filing review, and peer comparison – with the verification discipline that keeps the output reliable.
This hub is part of the How to Use AI for US Stock Market Trading series. The pillar post covers the full series architecture and which hubs to prioritise based on your current workflow.
Why Fundamental Research Takes So Long Manually
Keywords: how to use AI for stock research, AI fundamental analysis
The time cost isn't primarily reading speed. A skilled reader moves through a document quickly. The time cost is synthesis – finding the relevant sections in a 150-page filing, cross-referencing figures across multiple documents, comparing metrics against sector peers, and building a coherent picture from scattered data points that don't arrive in a convenient order.
An earnings release gives you the headline numbers. The transcript gives you management commentary. The 10-Q gives you detailed financial statements, risk factor updates, and footnotes where consequential details often live. Analyst estimates come from a third source. Peer comparison data from a fourth. Building a complete fundamental picture manually requires navigating all of these simultaneously.
This is precisely the kind of work AI accelerates most effectively. The synthesis task – extracting, organizing, and structuring information from multiple sources around a defined analytical framework – is something AI does faster than any human can manually, when given clean, well-sourced inputs and specific analytical questions.
What AI does not accelerate is the judgment required to determine what the fundamental picture means for a trade. Whether a company's 30% revenue growth justifies its current valuation. Whether margin compression represents a one-time headwind or a structural deterioration. Whether management commentary suggests genuine confidence or careful language management. Those assessments require experience, sector knowledge, and a framework developed over time. AI informs them. It does not make them.
The Four Fundamental Research Tasks AI Handles Well
Ratio Analysis
Financial ratios – P/E, forward P/E, PEG, EV/EBITDA, free cash flow margin, debt-to-equity – are the vocabulary of fundamental valuation. Understanding what each ratio says, and more importantly what it means in context, is where most fundamental analysis actually happens.
One nuance worth building into your prompts: different sectors have different dominant metrics. EV/EBITDA tends to be the primary lens for industrials and capital-intensive businesses. P/FCF often matters more for evaluating software and tech companies. Book value remains central to financial sector analysis. When you specify the sector in your prompt, AI can apply the right weighting to the right metrics rather than treating all ratios as equally meaningful across all contexts.
AI handles ratio analysis well when you bring the data. Paste a ratio table from Koyfin, Macrotrends, or a screener output, provide the sector context and historical benchmarks, and ask the model to assess what the combination of ratios suggests about valuation quality.
Important constraint: Use AI to extract and compare existing, pre-calculated numbers – not to perform raw arithmetic on financial statements. Large language models are semantic engines, not calculators. Asking an AI to calculate EV/EBITDA or a rolling PEG ratio from raw text leaves the door open to mathematical errors. Pull pre-calculated ratio tables from Koyfin, TradingView, or Macrotrends, then pass those structured figures into the AI for contextual analysis and peer mapping.
Transcript Extraction
Keywords: AI earnings transcript analyzer
Earnings call transcripts are where the most forward-looking, context-rich information about a business appears. Management prepared remarks, guidance language, responses to analyst questions – these contain signal that doesn't appear anywhere in the press release or financial statements. They're also long, dense, and written in a style that requires careful reading to extract the meaningful from the routine.
AI extracts transcript signal efficiently when given specific analytical questions. Rather than reading 40 pages to find the three points that matter, you paste the relevant sections and ask the model to identify guidance language shifts, management tone changes, and the topics analysts focused on most heavily in the Q&A.
Earnings call transcripts contain more signal than any other single document in a company's public disclosure. How to Analyze Earnings Transcripts with AI covers which sections to prioritise, how to prompt for tone shifts and guidance language changes, and what the Q&A clustering reveals about institutional concern.
Filing Review
Keywords: AI prompts for 10-Q filing review, how to analyze financial statements with Claude
10-K, 10-Q, and 8-K documents contain information that never makes it into press releases or analyst summaries – debt covenant details, risk language changes, specific liability disclosures, footnotes with material financial implications. Getting to that information manually requires knowing which sections to read and having the time to read them carefully.
AI handles the extraction step – pulling specific language from the sections you paste, identifying changes from prior filings you describe, and translating dense legal language into plain English – significantly faster than manual review.
Peer Comparison
Comparing a company's financial metrics against sector peers is fundamental to any valuation assessment – a P/E ratio only means something relative to the sector it's in and the growth rate supporting it. Manual peer comparison requires building a table of metrics across multiple companies from multiple sources, which takes time and introduces the risk of data inconsistency.
AI structures peer comparison efficiently when you paste a clean data table covering multiple companies across consistent metrics. The model identifies relative quality – which companies lead on financial strength, which trade at premiums or discounts relative to peers, which metrics diverge from the sector pattern.
The Verification Rule Specific to Fundamentals
The general verification rule – any specific figure AI provides must be confirmed against the original source before you act on it – applies with particular force in fundamental research because the figures involved directly inform valuation and trade sizing decisions.
Financial statements contain multiple similar-looking numbers that can be confused. GAAP net income and non-GAAP adjusted earnings appear in proximity in most earnings releases and can differ by hundreds of millions of dollars. Operating cash flow and free cash flow are related but distinct – the difference being capital expenditures, which can be substantial in capital-intensive businesses. Revenue and gross profit are different lines that can be mistaken for each other in a dense income statement.
The model can conflate these. When the analytical output rests on a specific financial figure – a margin percentage, a revenue growth rate, a debt ratio – that figure must be traced back to the source document before it informs any part of a trade decision.
The verification habit in fundamental research adds 5 to 8 minutes to a research session. It eliminates the risk of a trade thesis built on a misread number. Given that fundamental research typically informs larger, longer-duration positions than intraday technical setups, that risk is worth taking seriously.
How to Structure a Fundamental Research Session Using AI
A fundamental research session follows the same four-stage workflow as every other AI task in this series – gather data, prompt AI, verify output, make the decision – applied to the fundamental research context.
Stage 1 – Define the Research Question
Before gathering any data, be specific about what you're trying to determine. Not "I want to research Company X" – that's too broad to structure efficiently. Specific research questions produce specific, useful output:
"Is Company X's revenue growth rate sufficient to justify its current forward P/E premium versus its sector peers?"
"Has Company X's management changed its language around margin guidance in the most recent earnings call relative to the prior quarter?"
"Does Company X's debt structure include any covenant conditions that could become binding given the current rate environment?"
Each question defines what data to gather and what analytical task to give the model.
Stage 2 – Gather the Relevant Documents and Data
Primary sources first – SEC EDGAR for filings, the company's investor relations page for earnings releases and transcripts, Koyfin or Macrotrends for historical financial data and ratio tables, Finviz for screener outputs and peer comparison starting points.
One practical note on data formatting: When copying tables from SEC EDGAR or financial sites, the formatting often breaks into a wall of unstructured text when pasted into an AI prompt. Where possible, export data as CSV or use a platform like Koyfin's copy function, which preserves column structure. Clean, structured inputs produce significantly more accurate AI outputs than a chaotic paste of numbers with broken formatting.
Gather only the data that answers the specific research question. A researcher focused on margin trends doesn't need to paste the entire 10-Q – they need the income statement section, the margin commentary in the MD&A, and the prior quarter's equivalent sections for comparison.
Stage 3 – Prompt AI With Structured, Specific Questions
With the data in hand, construct the prompt using the framework from Blog 5 – role, context, data, specific task, constraints. For fundamental research, the constraint to base analysis only on provided data is particularly important. AI is prone to supplementing fundamental analysis with training data figures that may be significantly out of date – revenue numbers from the prior year, analyst estimates that have since been revised, management guidance that was subsequently updated.
Add this exact constraint to every fundamental research prompt:
Constraint: If the answer to a question cannot be found within
the pasted text, reply with "Data not present in provided context."
Do not use external historical knowledge or training data to fill gaps.
This single addition blocks the model from quietly substituting outdated training data when the pasted context doesn't contain the answer – which is the most common source of errors in AI-assisted fundamental research.
Here's a complete prompt example for ratio analysis:
Act as a fundamental analyst evaluating valuation quality for a
mid-cap semiconductor company.
Sector context: Semiconductors. The dominant valuation metrics for
this sector are forward P/E, EV/EBITDA, and P/FCF. Book value is
less relevant here than for financial sector names.
Data provided – ratio table from Koyfin (pre-calculated figures,
do not perform arithmetic):
[paste your ratio table here]
Sector median benchmarks (from Finviz sector filter):
[paste sector median data here]
Historical company averages (trailing 3 years, from Macrotrends):
[paste historical context here]
Based only on the data I've provided:
(1) Assess whether the current valuation reflects a premium, discount,
or fair value relative to the sector median – reference specific ratios.
(2) Identify any ratio that diverges significantly from the company's
own 3-year historical average and explain what that divergence
typically suggests.
(3) Assess whether the combination of ratios suggests valuation
quality consistent with the company's stated growth profile.
(4) Flag any metric that appears inconsistent with the others and
warrants closer manual review.
Constraint: If the answer to a question cannot be found within the
pasted text, reply with "Data not present in provided context."
Do not use external historical knowledge or training data to fill gaps.
No buy/sell recommendation. Frame as a valuation quality assessment only.
Stage 4 – Verify, Then Decide
Verify specific figures against source documents before drawing conclusions. Then apply judgment – does the fundamental picture support a trade thesis at the current valuation, in the current sector environment, given the technical setup? The research informs the decision. The decision requires everything AI cannot provide.
A Real Comparison – Manual vs. AI-Assisted Fundamental Research
Here's what the time difference looks like in concrete terms, using a semiconductor stock comparison as the example.
A retail trader wants to compare three semiconductor companies – NVDA, AMD, and AVGO – on four fundamental dimensions: revenue growth rate, gross margin trajectory, free cash flow margin, and forward P/E relative to sector median.
Manual process:
Navigate to each company's most recent 10-Q on EDGAR. Find the relevant financial statement sections for each. Copy the figures into a spreadsheet. Cross-check against the prior quarter for each company. Source the forward P/E estimates from a financial data platform. Source the sector median from a second platform. Build a comparison table manually. Identify the strongest and weakest on each dimension.
Time: approximately 3.5 to 4 hours for three companies.
AI-assisted process:
Export a comparison table from Koyfin covering all four metrics for the three companies plus the semiconductor sector median – using Koyfin's structured copy function to preserve column formatting. Paste the table into Claude alongside the specific research question, the analytical framework, and the guardrail constraint. Ask the model to rank by fundamental quality, identify the strongest on each dimension, and flag any metric that diverges significantly from the peer group or from each company's own recent trend.
Time: approximately 35 minutes – including data sourcing, the prompt, the AI session, and the verification pass on key figures.
In this example, the AI analysis flagged a debt covenant detail buried in AVGO's 10-Q footnotes – specifically because the trader had pasted the relevant debt footnote section into the prompt alongside the ratio table. The manual review, compressed by time pressure, had moved through the footnotes too quickly to catch it. The figure was verified against the actual EDGAR filing before it informed the investment thesis.
That's the practical case for AI-assisted fundamental research. Not a shortcut that reduces quality – a compression of the time cost that allows the same quality of analysis in a fraction of the time, with the verification discipline that keeps the output reliable.
What This Hub Covers
Seven posts cover each major fundamental research task in depth.
How to Do Fundamental Stock Screening with AI – The right relationship between screeners and AI: use Finviz or Koyfin to screen, use AI to analyze the results. Covers the fundamental criteria worth screening for and how to structure the AI ranking prompt for screener outputs.
How to Analyze Earnings Transcripts with AI – Why transcripts contain more signal than the press release, which sections to prioritize, and how to prompt AI to extract guidance language shifts and management tone changes that a headline reader misses.
How to Use AI to Read Insider Transaction Data – Form 4 data, cluster buying signals, the difference between meaningful insider transactions and routine activity, and how to structure an AI interpretation prompt for insider activity.
How to Evaluate Valuation and Financial Ratios Using AI – P/E, forward P/E, PEG, EV/EBITDA, P/FCF – what each measures, why sector context determines meaning, and how to use AI to contextualize a ratio table against historical averages and peer medians.
How to Compare Companies Across Sectors Using AI – The right approach to peer comparison within a sector and across sectors, how to structure a comparison table for AI input, and what a useful AI peer comparison output looks like.
How to Analyze Growth, Margins, and Cash Flow Using AI – The three metrics that identify high-quality businesses – revenue growth rate, gross margin trajectory, and free cash flow margin – and how AI identifies the earnings quality signals that most traders don't look for.
How to Analyze Unusual Options Activity and Flow Data Using AI – What options flow data reveals about institutional positioning, where to source it, how to structure the signal interpretation prompt, and the important caveat that separates directional signals from hedging activity.
Frequently Asked Questions
Q1: AI models are prone to hallucinations. How can I trust them with sensitive 10-Q or 10-K financial details?
You don't trust them blindly – that's where the verification rule comes in. AI handles semantic extraction well: pulling text, matching patterns, identifying language shifts. It doesn't generate flawless accounting records from scratch. Using the guardrail constraint in your prompt – "If the answer cannot be found within the pasted text, reply with 'Data not present in provided context.' Do not use external historical knowledge." – eliminates the model's tendency to fill gaps with outdated training data. Always cross-check final numbers against the actual SEC EDGAR filing before any number informs a trade decision.
Q2: Why paste custom tables into a general LLM instead of using a specialized financial AI tool?
Specialized tools are powerful, but general models like Claude offer an unconstrained sandbox for custom qualitative reasoning. When you paste data directly, you control the analytical framework entirely. You can direct the AI to focus on your specific risk criteria, governance red flags, or custom margin constraints – rather than accepting a generic automated summary score generated by a third-party application. The custom prompt is the edge.
Q3: How do I prompt an AI to find a guidance language shift in a dense earnings transcript without reading the whole thing?
Paste the guidance or outlook sections from both the current quarter and the prior quarter into the same prompt window. Then use this structure:
Act as a forensic financial analyst. Compare Section A (current quarter
guidance) and Section B (prior quarter guidance). Highlight any
omissions, softer verbs – for example, a shift from 'we expect' to
'we anticipate' – or modifications to capital expenditure parameters.
Summarize what these phrasing changes may imply about management's
internal confidence level.
Constraint: Base your analysis only on the text provided. Do not
reference historical earnings data from your training.
The output surfaces language shifts that a quick read would typically miss.
Q4: Can I use an AI model to calculate financial ratios from scratch using raw income statement text?
No. Large language models are semantic prediction engines, not calculators. While they're improving at basic arithmetic, asking an LLM to calculate complex metrics like EV/EBITDA or a rolling PEG ratio from raw text leaves the door open to mathematical errors that can look convincing in a structured output. Run your screens or pull pre-calculated ratio tables from platforms like Koyfin or TradingView, then pass those structured figures into the AI for contextual analysis and peer mapping. The AI's job is interpretation, not arithmetic.
Q5: When conducting a peer comparison across companies with misaligned fiscal calendars – like the NVDA, AMD, and AVGO example – how do I handle the mismatch?
State the calendar boundaries explicitly in the context layer of your prompt. For example: "Note: AVGO's fiscal quarters run one month ahead of NVDA and AMD." Then direct the AI to normalize its evaluation by focusing on trailing twelve-month (TTM) figures or relative year-over-year percentage growth rates, rather than raw sequential quarterly comparisons that don't align on the same time periods. Flagging the mismatch upfront prevents the model from drawing comparisons across non-equivalent periods.