
Prerequisites: Basic candlestick knowledge (what a high/low is) and familiarity with the idea of swings. If you are completely new to charts, start with our Candlestick Basics guide first.
Market structure is not a strategy. It’s not a signal either. It’s the foundation that every other technical concept rests on. Before you can talk about breakouts, trend following, momentum, or even basic chart reading, you need to understand what the market is actually doing right now – whether it’s trending, reversing, or just chopping around.
Higher highs and higher lows (often shortened to HH/HL) are the most basic building blocks of an uptrend. If you can spot these cleanly on a chart, you already have a working model of market structure that most traders overlook.
This guide walks you through what higher highs and higher lows are, how to identify them without guessing, why they matter for understanding trend direction, and how they fit into the broader framework of swing points that define market structure uptrend conditions.
What Is Market Structure?
Market structure is simply the arrangement of price highs and lows over time. Price doesn't move in a straight line. It moves in waves – up, then a partial pullback, then up again, or the reverse. The pattern formed by these peaks and troughs tells you the direction and health of the underlying trend.
There are three core market states:
Uptrend: Characterized by higher highs and higher lows
Downtrend: Characterized by lower highs and lower lows
Sideways / Range-bound: Characterized by roughly equal highs and lows
This guide focuses on the uptrend structure – HH and HL. The companion article on lower highs and lower lows covers the bearish structure in detail, and the range-bound trading strategy post covers the sideways case.
Defining Higher Highs and Higher Lows
Let's be precise about what these terms mean, because vague definitions lead to misidentification on charts. In practice, this is where trend analysis for beginners often goes wrong.
Higher High (HH)
A higher high occurs when a price peak exceeds the previous peak. Not every uptick qualifies. You are looking for a clearly defined swing high – a point where price rises, stalls, and then pulls back – that is higher than the last swing high.
Example: If the previous swing high was at ₹450, and the next rally takes price to ₹478 before pulling back again, that ₹478 point is a higher high. The key word is "swing." A higher high is a completed move, not a live candle still pushing upward.
Higher Low (HL)
A higher low occurs when a pullback (retracement) ends at a point above the previous pullback low. After a higher high is set, price corrects. If that correction holds above the last time price corrected – above the last swing low – you have a higher low.
Example: If the previous pullback low was at ₹418, and the current correction finds support at ₹431 before turning back up, that ₹431 is a higher low.
Visual Example (Simplified)
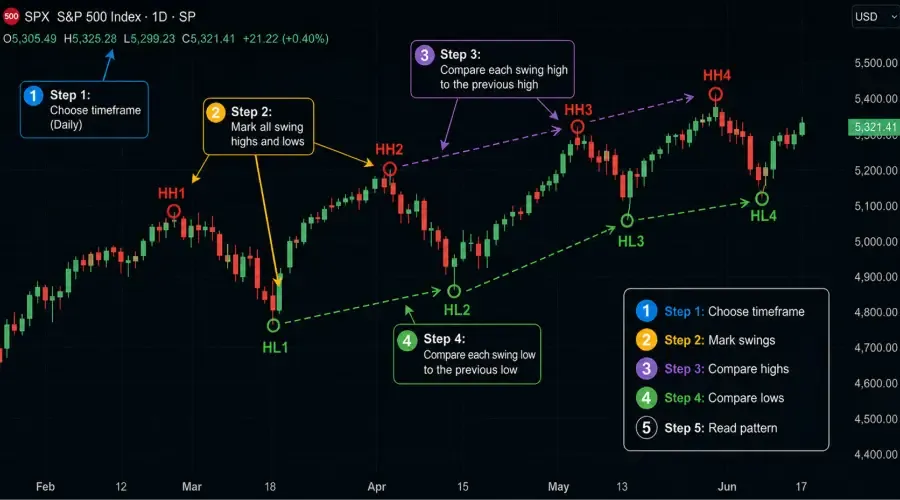
Description: A price chart showing an upward slope. Swing highs labeled HH1, HH2, HH3, each higher than the last. Swing lows labeled HL1, HL2, HL3, each higher than the last. Arrows connect them to show the sequence HH → HL → HH → HL.
Together, the sequence looks like this in ASCII form:
text
Price
  |             HH2
  |  HH1       /.  \
  | /   \     /.    \
  |/     \   /.      \
  |       \ /         \HL3
  | HL1    HL2
  +-----------------> Time
Each successive peak is higher than the last. Each successive trough is higher than the last. That's the structure of an uptrend.
Why This Pattern Matters
The HH/HL pattern is not just a pretty picture of an uptrend. It tells you something real about the balance of power between buyers and sellers.
When price makes a higher low, it means the correction – the move against the trend – ran out of steam at a higher level than before. The traders stepping in on the long side are willing to do so at progressively higher prices. The floor is rising.
When price then makes a higher high, it means the next rally cleared the previous peak. The ceiling is also rising.
That dual confirmation – a rising floor and a rising ceiling – is what separates a genuine uptrend from a quick bounce or a one-off spike. You need both conditions. A higher high without a higher low (say, a sharp rally that immediately falls back below the previous trough) does not confirm healthy trend structure.
Here’s what matters for price action market structure: experienced traders watch the lows just as closely as the highs during a rally. The quality of the pullback often tells you more about trend strength than the quality of the advance.
The Role of Swing Points
To identify HH and HL accurately, you first need to identify swing highs and swing lows. These are the raw building blocks. (For a dedicated breakdown, see the companion post on Swing Highs and Swing Lows: The Building Blocks.)
A swing high is a candle (or bar) that is flanked by lower highs on both sides – a local peak. A swing low is a candle flanked by higher lows on both sides – a local trough. Most traders use a minimum of two candles on each side for confirmation; some use three.
Practical rule: Use the timeframe that matches your analysis purpose. If you are studying weekly trend structure, weekly swing points are the relevant reference. If you are watching intraday price action, intraday swings define your structure.
The most common mistake new traders make is cherry-picking arbitrary points as "highs" and "lows" rather than identifying true swing points. For example, marking the high of a single up-candle that is not a swing peak (no lower candles on both sides) leads to false signals. This results in inconsistent readings and incorrect trend assessments.
Reading HH/HL on a Real Chart
Here is a step-by-step process for identifying swing points and reading HH/HL on any chart:
Step 1: Choose your timeframe and stick to it.
Mixing signals from different timeframes in a single analysis creates confusion. Start with one timeframe, identify all swing points, then note the structure formed.
Step 2: Mark all swing highs and swing lows.
Go left to right. Mark each local peak (swing high) and each local trough (swing low). Do not skip any significant pivot.
Step 3: Compare each swing high to the previous one.
Is the new swing high above the last one? If yes, that is a higher high. If the new swing high is below the last one, that is a lower high – a warning sign that the uptrend may be weakening.
Step 4: Compare each swing low to the previous one.
After marking the pullback, is the new swing low above the previous swing low? If yes, that is a higher low. If the new swing low is below the previous one, that is a lower low – a more serious structural breakdown.
Step 5: Read the pattern.
A sequence of HH → HL → HH → HL = confirmed uptrend structure.
The Trend Condition Matrix (HH/HL vs. Breakdown)
Not every combination of swing highs and lows tells the same story. Use this market structure trend condition matrix to quickly assess the state of trend:
| Current Swing High vs Previous | Current Swing Low vs Previous | Trend Status |
|---|---|---|
| Higher High (HH) | Higher Low (HL) | Healthy uptrend – structure intact |
| Higher High (HH) | Lower Low (LL) | Mixed / weakening – rally but lower low breaks prior support. Potential topping pattern. |
| Lower High (LH) | Higher Low (HL) | Choppy / contracting – range or consolidation. Uptrend paused. |
| Lower High (LH) | Lower Low (LL) | Downtrend confirmed – structure has flipped. |
This matrix helps you avoid the common error of calling a trend "over" after a single lower low, or calling it "healthy" after one higher high without looking at the low.
When HH/HL Structure Breaks Down
No trend lasts forever. Understanding the HH/HL framework also means understanding the signals that suggest it is ending or weakening.
First Warning: Failure to make a higher high
If price rallies but cannot exceed the previous peak, it instead forms a lower high (LH). This does not immediately confirm a reversal, but it puts you on alert.
The More Significant Signal: Break of a prior swing low
When price declines below a prior higher low (a swing low that had previously held), that is a Break of Structure (BOS). If accompanied by a decisive close below that level, the uptrend structure is likely invalidated. In more aggressive cases, this becomes a Change of Character (ChoCh) – see the dedicated post on Break of Structure vs. Change of Character for full details.
You’ll often hear traders debate break of structure (BOS) vs trend changes. The short version: a single wick below a low isn’t enough – you want a close.
Important: Structure breaks are confirmed by closes, not just wicks (intraday spikes). A wick that briefly touches below a prior low but closes back above is not a confirmed break. Also, breaks are more meaningful when they occur with increased volume or at significant support/resistance levels.
Common Mistakes When Reading Market Structure
1. Forcing the pattern
Not every chart has clear HH/HL structure. Sometimes the market is in a range, and traders force-fit trend labels onto sideways price action. If highs and lows are roughly equal over an extended period, the market is consolidating – not trending. Respect the range.
2. Using too small a timeframe
On very small timeframes (1-minute, 5-minute), the noise overwhelms the signal. You will see dozens of "swing highs" and "swing lows" that are just random fluctuations. Use a timeframe where each swing represents a meaningful move (e.g., 1-hour, daily).
3. Ignoring the sequence
A single higher high does not confirm an uptrend. You need the full sequence: higher high followed by a higher low followed by another higher high. The HL is the confirmation that the pullback held structural integrity.
4. Confusing price level with trend direction
A stock at an all-time high is not necessarily in a healthy HH/HL structure. The pattern of swings matters, not just the absolute price level.
What to Do After Identifying HH/HL Structure
Market structure is not a trade signal, but it provides a contextual framework for decision-making. Once you have identified a clean HH/HL uptrend:
Wait for a pullback to a prior HL area – These are natural structural support zones. Not every pullback will be a trade, but they become high-probability areas for analysis.
Use the most recent HL as your structural invalidation level – If price breaks below that HL and closes below it, the uptrend structure is compromised. That is your line in the sand. Many traders use swing lows for stop loss placement precisely this way.
Do not take counter-trend positions – Until you see a clear LH/LL structure (downtrend), trying to short a HH/HL uptrend is fighting the structure.
Combine with other tools – Structure tells you where price is; add volume, momentum, or support/resistance for entry timing. For example, a pullback to a rising 50-day moving average that coincides with a higher low is a stronger confluence.
Timeframe Alignment and Multi-Timeframe Structure
One of the most useful applications of HH/HL analysis is across multiple timeframes. A common framework used by structured traders is:
Higher timeframe (weekly or daily): Defines the primary trend direction
Lower timeframe (4-hour or 1-hour): Used to observe pullbacks within that trend
For example: if the weekly chart shows a clear HH/HL sequence, a pullback on the daily or 4-hour chart that holds above a prior swing low represents a structure-consistent retracement within the larger uptrend. Traders who understand multi-timeframe structure use this alignment to better contextualize what they are observing – not as a trigger for action, but as a filter for understanding where price stands within the larger picture.
This concept of alignment is one reason why structure analysis is a prerequisite skill before studying momentum, breadth, or any other overlay. Without knowing the structural context, you cannot meaningfully interpret any signal that appears within it.
Summary
Higher highs and higher lows define the most basic building block of an uptrend. Here is the core framework condensed:
A higher high is a swing peak that exceeds the previous swing peak
A higher low is a pullback trough that holds above the previous pullback trough
Together, the sequence HH → HL → HH → HL confirms healthy uptrend structure
The quality of the pullback (higher low) is often more informative than the rally itself
Use the trend condition matrix to quickly assess whether structure is healthy, weakening, or reversing
Structure begins to show weakness when price forms a lower high (LH) and confirms breakdown when it closes below a prior swing low
Apply this framework consistently on one timeframe, then check alignment on higher timeframes for broader context
After identifying HH/HL, use prior HLs as structural support levels, avoid counter-trend trades, and combine with other tools for timing
Market structure does not predict the future. It describes the present arrangement of price – whether the market is organized in a way consistent with an uptrend, a downtrend, or a range. That description is the starting point for every other analytical tool you will encounter in technical analysis.
FAQ
Q: Does a higher high always mean the trend will continue?
A: No. A higher high indicates bullish momentum, but for a healthy uptrend structure, it must be followed by a higher low. If price makes a higher high but then crashes below the previous low, it suggests a "fakeout" or an exhaustive move rather than a sustainable trend. Learning the difference between higher high and lower high is critical here.
Q: Which timeframe is best for identifying market structure?
A: Market structure is fractal, meaning it exists on all timeframes. However, higher timeframes (Daily or Weekly) provide more "weight" and reliability. Beginners should start with the Daily chart to filter out the noise found on 1-minute or 5-minute charts.
Q: What is the difference between a wick and a close in market structure?
A: In professional structure analysis, a Break of Structure (BOS) is usually only confirmed when a candle closes above a prior high or below a prior low. A "wick" (the thin line) that pokes through a level but retreats is often just a sign of liquidity grabbing, not a structural shift.
Q: Can I trade using only higher highs and higher lows?
A: While HH/HL provides the "map" of the market, most traders use it as a context filter rather than a standalone signal. It tells you how to identify a healthy uptrend and which direction to trade (long in an uptrend), while tools like volume, RSI, or candlestick patterns help you decide when to enter.
Q: What happens if the market makes a Lower High during an uptrend?
A: A lower high (LH) is the first warning sign of trend exhaustion. It indicates that buyers no longer have the strength to push price above the previous peak. While it doesn't confirm a reversal, it often leads to a sideways range or a potential trend change.
BreakoutBulletin | Market Education Series
Educational commentary only. Not investment advice. Past performance does not guarantee future results.