
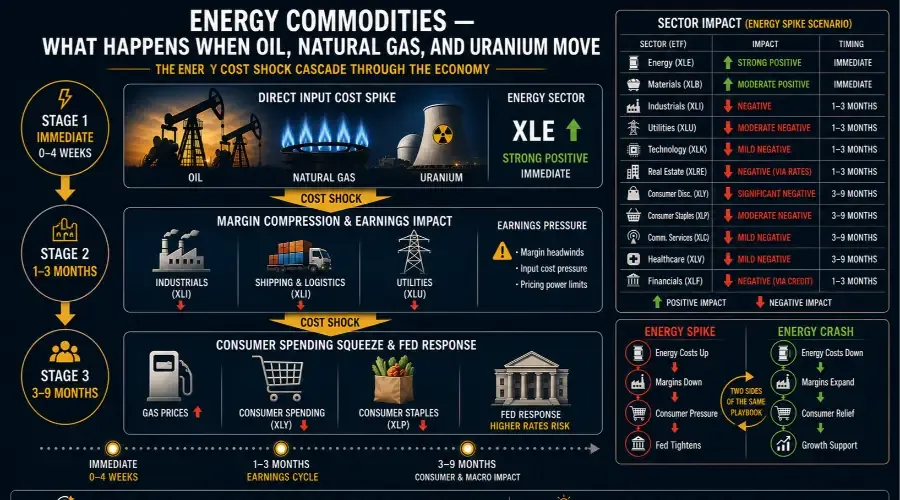
Of all the market catalysts that exist, energy price moves are the most consequential – and the most predictable in their transmission. Energy is not one input among many. It is the cost floor underneath every business in the economy. Every factory, every ship, every data center, every hospital, every farm runs on energy. When its price moves sharply, nothing stays insulated for long.
This hub is your complete reference for energy-driven market events – your energy market playbook. It covers crude oil spikes and crashes, natural gas surges, gasoline price shocks, and uranium price moves. Five events that recur across every market cycle, each triggering a distinct, traceable chain of sector reactions. Once you understand how oil prices affect the stock market, you’ll start seeing the chain before it fully unfolds.
Why Energy Is the Economy's Most Powerful Cost Shock
Energy sits at the top of the production hierarchy. This matters enormously for traders because it means energy price moves travel in one direction only: downstream.
When crude oil spikes, the first sectors to feel it are the ones that use energy as a direct input – transportation, chemicals, airlines, shipping. Within weeks, the cost pressure transmits to manufacturers who need to move goods. Within quarters, it reaches the consumer through higher prices at the pump and rising prices on everything that was shipped, stored, or manufactured using energy. When energy costs stay elevated long enough, the pressure reaches the Federal Reserve – which eventually tightens policy to fight the inflation that energy costs helped create.
This cascade is the reason energy events produce the longest and most broadly felt ripple effects in the market. A single oil spike can affect sector earnings for four to six consecutive quarters across the entire economy. The crude oil impact on stocks simply takes time to work through the layers.
The opposite is equally powerful. When energy prices crash – as they did from 2014 to 2016 when OPEC flooded the market, and again briefly in 2020 during COVID demand destruction – the cost relief flows downstream just as predictably. Consumer discretionary spending power increases. Manufacturer margins expand. Airlines and logistics companies see their single largest input cost fall. The sector beneficiaries are the mirror image of the losers in an energy spike.
Understanding this bidirectional cascade is the foundation of every energy catalyst trade in this hub.
The Energy Transmission Mechanism: How It Moves Through the Economy
The pathway from an energy price event to sector impact follows a consistent three-stage sequence. Knowing these stages – and their timing – is what separates reactive trading from anticipatory positioning. In practice, this is the oil price transmission mechanism that repeats across every cycle.
Stage 1: Immediate Impact (0–4 Weeks)
Energy sector stocks reprice within days of a major crude or gas move. This is mathematical – if WTI crude rises 20%, the revenue line of every exploration and production company rises in direct proportion. XLE (the Energy Select Sector ETF) typically moves 60–80% as fast as crude oil itself in the short term.
Simultaneously, the sectors with the highest direct energy exposure reprice almost as fast: airlines (within XLI), shipping companies, and chemical manufacturers. These businesses have limited ability to hedge quickly, so the market reprices their forward earnings immediately.
What to watch in Stage 1: XLE relative to crude oil. If crude spikes but XLE lags, the market is pricing in a short-lived move. If XLE runs ahead of crude, institutional money is pricing in sustained higher prices – that is the stronger signal.
Stage 2: Earnings Cycle Transmission (1–3 Months)
This is the stage that most retail traders miss because it arrives after the news cycle has moved on. Input cost changes take one full quarter to appear in reported earnings. During this window, management commentary on earnings calls becomes the primary signal – listen for phrases like "margin headwinds," "input cost pressure," and "pricing power limitations."
Sectors that feel Stage 2 most acutely: Industrials (XLI), where transport and manufacturing costs are directly tied to energy prices; Consumer Staples (XLP), where packaging, logistics, and refrigeration costs all have energy components; and Utilities (XLU), where natural gas is a primary fuel source for power generation.
What to watch in Stage 2: XLI and XLP guidance revisions on earnings calls. When Staples companies begin lowering forward margin guidance citing energy costs, the consumer impact is two to four weeks away.
Stage 3: Consumer and Fed Response (3–9 Months)
The full energy shock reaches consumer behavior in Stage 3. Gasoline prices affect discretionary spending directly – when households spend more at the pump, they spend less at restaurants, retailers, and on entertainment. This is the stage where XLY (Consumer Discretionary) and XLC (Communication Services, which includes ad-dependent businesses) show the most sustained underperformance.
Simultaneously, sustained energy-driven inflation brings the Federal Reserve into the picture. If CPI is running hot because of energy costs, the Fed faces pressure to tighten – adding a liquidity shock dimension on top of the original cost shock. This is the compounding mechanism that turned the 2022 energy spike into the worst year for equities in over a decade.
What to watch in Stage 3: CPI energy components (published monthly by BLS), Fed commentary on energy's contribution to inflation, and XLY relative performance versus XLP. When discretionary stocks underperform staples by more than 5% over a quarter, the consumer is absorbing Stage 3 energy pressure.
Sector Reaction Map: Energy Spike vs. Energy Crash
The table below shows the directional impact and approximate timing for each sector across the two most important energy scenarios. You’ll notice that timing is everything – the most durable trades almost always sit in the lagged windows, not the initial shock.
Energy (XLE) shows a ✅ Strong Positive impact during an energy spike, and a ❌ Strong Negative impact during an energy crash, with the primary timing being Immediate.
Materials (XLB) shows a ✅ Moderate Positive impact during an energy spike, and a ❌ Moderate Negative impact during an energy crash, with the primary timing being Immediate.
Industrials (XLI) shows a ❌ Negative impact during an energy spike, and a ✅ Positive impact during an energy crash, with the primary timing being 1–3 Months.
Utilities (XLU) shows a ❌ Moderate Negative impact during an energy spike, and a ✅ Moderate Positive impact during an energy crash, with the primary timing being 1–3 Months.
Technology (XLK) shows a ❌ Mild Negative impact during an energy spike, and a ✅ Mild Positive impact during an energy crash, with the primary timing being 1–3 Months.
Real Estate (XLRE) shows a ❌ Negative (via rates) impact during an energy spike, and a ✅ Positive impact during an energy crash, with the primary timing being 1–3 Months.
Consumer Disc. (XLY) shows a ❌ Significant Negative impact during an energy spike, and a ✅ Significant Positive impact during an energy crash, with the primary timing being 3–9 Months.
Consumer Staples (XLP) shows a ❌ Moderate Negative impact during an energy spike, and a ✅ Moderate Positive impact during an energy crash, with the primary timing being 3–9 Months.
Comm. Services (XLC) shows a ❌ Mild Negative impact during an energy spike, and a ✅ Mild Positive impact during an energy crash, with the primary timing being 3–9 Months.
Healthcare (XLV) shows a ❌ Mild Negative impact during an energy spike, and a ✅ Mild Positive impact during an energy crash, with the primary timing being 3–9 Months.
Financials (XLF) shows a ❌ Negative (via credit) impact during an energy spike, and a ✅ Positive impact during an energy crash, with the primary timing being 1–3 Months.
Reading this table correctly: The timing column is as important as the direction. Energy spike trades on XLE are immediate – they are already priced in within days. The more durable opportunity in an energy spike is the lagged short on XLY and XLP, built two earnings cycles before the consumer impact fully materializes in reported results.
The Three Energy Variables That Change Everything
Not all energy events are identical. Three variables determine the magnitude, duration, and sector spread of any energy catalyst:
1. Supply-driven vs. demand-driven
A supply shock (OPEC cut, geopolitical disruption, pipeline failure) produces faster, sharper price moves with more uncertainty about duration. A demand-driven energy move (economic boom pulling oil higher, recession collapsing demand) is slower but more persistent. Supply shocks favor short-term energy sector trades. Demand-driven moves create better conditions for multi-quarter sector rotation trades.
2. Magnitude and velocity
A crude move from 75 to 85 (+13%) is noise. A move from 75 to 110 (+47%) in six weeks – like the early 2022 post-invasion spike – triggers the full three-stage cascade described above. The threshold where energy moves from a sector story to a macro story is roughly a sustained 30%+ move in crude or a doubling in natural gas prices.
3. Duration expectations
A brief energy spike (less than four weeks) rarely reaches Stage 2 transmission. Companies hedge, inventories absorb the shock, and the earnings impact is minimal. Sustained energy moves – lasting one quarter or more – are what produce the full multi-sector cascade. Always assess whether the energy move has a structural catalyst (OPEC policy change, geopolitical reconfiguration, infrastructure shortage) or a temporary one (weather event, brief supply disruption).
Key Historical Energy Shocks and What They Produced
2021–2022: Russia-Ukraine War Energy Shock
WTI crude ran from 78 to 130 in six months following the February 2022 invasion. European natural gas prices increased tenfold at their peak. XLE gained 65% in 2022 – the best-performing sector by a margin of over 40 percentage points. XLY fell 37% – the worst sector. Consumer margin compression appeared exactly two earnings cycles after the initial energy spike, matching the Stage 2–3 transmission model precisely.
2014–2016: OPEC Production War
Saudi Arabia's decision to defend market share rather than price sent WTI from 107 to 26 in 18 months. XLE fell 35% over two years. XLY significantly outperformed – fuel savings boosted consumer spending power. Airlines (within XLI) recorded their largest margin expansion in a decade as jet fuel costs collapsed. This is the definitive case study for the energy crash playbook.
2008: Oil at 147 – Pre-Crisis Peak
The July 2008 crude peak at 147 per barrel was the last act of the commodity supercycle before the financial crisis. Energy stocks outperformed through mid-2008 even as the broader market deteriorated. The Stage 3 consumer impact – compressed disposable income meeting tightening credit – combined with the GFC to produce an extreme coincident shock. The energy crash that followed the July peak (crude fell to $32 by December) then reversed the playbook equally fast, benefiting airlines and consumer names.
2005–2008: Uranium Bull Market
Uranium prices rose from 7/lb in 2003 to 136/lb in 2007 – a 19x move driven by the nuclear power renaissance thesis and supply constraints. This is the only energy commodity that does not directly transmit through the standard sector cascade: uranium's primary impact is on utility companies with nuclear fleets and on nuclear equipment manufacturers. The trading logic is different from crude or gas – covered in detail in the uranium filler post.
How to Trade Energy Catalyst Events: The Three-Phase Checklist
Use this checklist before, during, and after any major energy price move. And one word of caution up front: energy events can gap hard – position size accordingly and respect the volatility.
Before an energy catalyst event:
Identify the trigger type: supply shock, demand shock, or policy decision (OPEC)
Assess current positioning: is XLE already pricing in the move?
Check natural gas and crude oil spread: both moving together signals broad energy strength; divergence signals commodity-specific dynamics
Identify your Stage 2 candidates: which XLI and XLP names have the highest unhedged energy cost exposure?
During the event:
Watch XLE vs. crude oil ratio – divergence tells you whether the market believes the move is durable
Monitor XLY relative to XLP – staples outperforming discretionary confirms consumer pressure is beginning to build
Track the dollar: energy and USD typically move inversely – a dollar rally that coincides with an energy spike partially offsets the commodity price impact for global companies
After the event (the lagged trades):
Set a one-quarter reminder to review XLI and XLP earnings guidance for energy cost commentary
Build your Stage 3 watchlist: which XLY names have the least pricing power to offset rising input costs?
Watch Fed language on energy's contribution to CPI – if the Fed starts calling out energy explicitly, the liquidity shock layer is about to be added on top of the cost shock
If you trade outside the US, the same transmission logic applies – just use equivalent local sector indices or commodity-linked ETFs; the chain reaction is global
Five Energy Events Covered in This Hub
Each post below covers one specific energy catalyst with full Before / During / After trading analysis, sector reaction maps, and three or more historical case studies.
→ What Happens When Crude Oil Prices Spike (High priority – 1,000+ monthly searches)
The most consequential energy event in global markets. Covers the full three-stage downstream cascade, the sector rotation playbook, historical cases from 2022, 2008, and 1990, and the indicators that signal whether a spike has legs or will reverse. [link]
→ What Happens When Crude Oil Prices Crash (High priority – 900+ monthly searches)
The mirror image of the spike playbook. Covers the consumer windfall effect, airline and logistics margin expansion, XLE capital expenditure destruction, and the scenarios where an energy crash is a warning signal rather than a consumer tailwind. [link]
→ What Happens When Natural Gas Prices Surge (Medium priority – 700+ monthly searches)
Natural gas operates on different supply-demand dynamics than crude oil – its pricing is more regional, more seasonal, and more volatile. Covers the utility sector impact (XLU), European energy market dynamics, LNG export economics, and the winter demand cycle that makes Q4 the highest-risk quarter for gas price volatility. [link]
→ What Happens When Gasoline Prices Rise Sharply (Medium priority – 600+ monthly searches)
The consumer-facing energy event. Gasoline price spikes are one of the fastest-transmitting economic pressures on discretionary spending – the impact on consumer behavior is measurable within weeks, not quarters. Covers the XLY spending rotation, regional economic differences, and the political response dynamic that sometimes produces policy interventions. [link]
→ What Happens When Uranium Prices Spike (Medium priority – 500+ monthly searches)
Uranium is the energy market's most misunderstood catalyst. It does not follow crude oil dynamics. Its primary market impact is on utility companies with nuclear generation capacity and on junior mining stocks – not on the broad energy sector ETF. Rather than rippling through broad consumer sectors, uranium's impact is concentrated in utility nuclear generation fleets and junior mining stocks. Covers the nuclear power renaissance thesis, the uranium supply cycle (dominated by Kazakhstan and Canada), and the equity vehicles that capture uranium price moves. [link]
Continue Through the Catalyst Series
This hub is one of seven in the What Happens When series. Each covers a distinct catalyst category with its own transmission mechanism and sector playbook.
→ Pillar: The Complete Market Catalyst Framework
→ Hub 2: Industrial & Base Metals – Copper, Steel, Lumber
→ Hub 3: Precious Metals – Gold, Silver, Platinum
→ Hub 4: Agricultural Commodities – Wheat, Corn, Soybeans
→ Hub 5: Macroeconomic Events – Fed, CPI, NFP, GDP
→ Hub 6: Central Bank & Policy – QE, Tapering, Tariffs, Tax
→ Hub 7: Geopolitical Events – Wars, Elections, OPEC, EM Crisis
Frequently Asked Questions
1. What happens when oil prices rise in the stock market?
When oil prices rise, energy stocks typically gain first, while sectors like airlines, logistics, and consumer discretionary face rising costs. Over time, higher fuel costs reduce consumer spending and increase inflation.
2. How do energy prices affect different sectors?
Energy price changes impact sectors in stages:
Energy (XLE) reacts immediately
Industrials (XLI) and utilities (XLU) follow
Consumer sectors (XLY, XLP) are affected later
This creates a predictable sector rotation pattern.
3. What is an energy cost shock in markets?
An energy cost shock occurs when oil or gas prices rise sharply, increasing production and transportation costs across the economy. This leads to margin compression and eventually impacts consumer demand and inflation.
4. How long does it take for oil price changes to impact stocks?
The impact happens in phases:
Immediate (0–4 weeks): Energy stocks react
1–3 months: Earnings and margins adjust
3–9 months: Consumer spending and inflation effects appear
5. Which stocks benefit from rising oil prices?
Energy companies, oil producers, and commodity-linked businesses benefit the most. ETFs like XLE and XLB typically outperform during oil price spikes.
6. What happens when oil prices crash?
When oil prices fall, consumer spending increases, transportation costs drop, and sectors like airlines and retail benefit. However, energy stocks decline sharply.
7. How do natural gas prices impact the market?
Natural gas price increases affect utilities and power generation companies the most. They also influence electricity costs and regional economic activity.
8. Does the Federal Reserve react to energy prices?
Yes, if rising energy prices push inflation higher, the Federal Reserve may increase interest rates, creating a secondary liquidity shock in the market.
All content on BreakoutBulletin is for educational purposes only and does not constitute financial advice or a recommendation to buy or sell any security.