
BreakoutBulletin | BB Trading Frameworks Series
Part of the 5-Layer Trading Framework Master Guide
Educational commentary only. Not investment advice.
The Problem With Trading Economic News
Most retail traders have experienced the same sequence. A major economic release hits. The market spikes sharply in one direction. They enter. The market reverses completely. They were right on direction. They were wrong on timing.
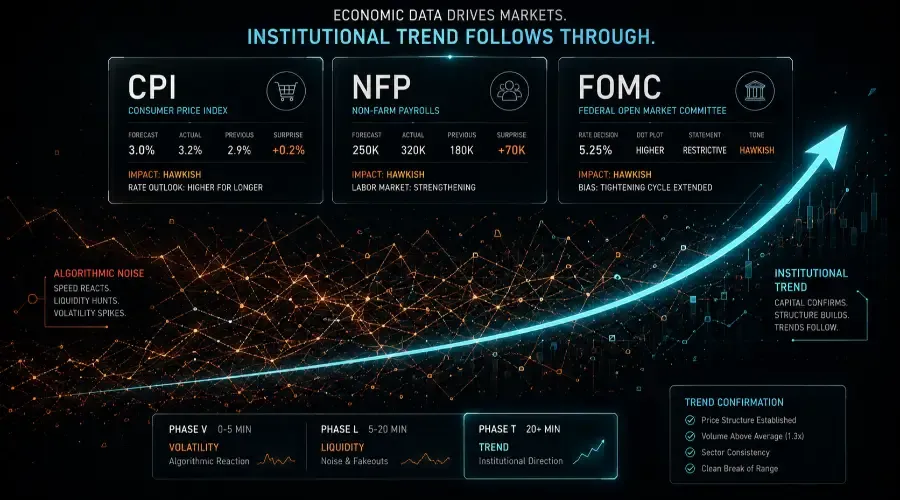
The error is not in reading the data. It is in when the trade is placed. The initial move after a CPI, NFP, or FOMC release is driven by algorithms executing pre-programmed responses, stop hunts clearing liquidity below obvious levels, and spread widening that distorts entry prices. Institutional direction – the move that actually follows through – does not form until that process has cleared.
The V.L.T. Framework addresses this directly. It structures the post-release period into three phases based on observable market behaviour, and identifies where the actionable window actually sits.
What the Economic Calendar Actually Tells You
Most traders focus on the scheduled time of a release. That is the least informative element. The signal comes from three numbers read together: the forecast, the actual, and the previous reading.
Markets do not react to economic data in absolute terms. They react to the difference between what was expected and what was delivered. A CPI print of 3.2% means almost nothing without knowing that the consensus forecast was 3.0% – the 20 basis point surprise is the market-moving variable, not the number itself.
This is why a strong employment number can trigger a selloff. If consensus expected 250,000 jobs and the print comes in at 180,000, the market perceives deterioration. If the print comes in at 320,000 against the same 250,000 forecast, the reaction is hawkish – fewer rate cuts are now priced in – which can pressure growth stocks even though the data is objectively positive.
Understanding deviation, not the data itself, is the foundation of the framework. This connects directly to the regime identification process in the Market Regime Identification Framework, where how the market reacts to economic data is treated as more informative than the data point itself.
The Three Data Releases That Move Markets Most
CPI – Consumer Price Index
CPI is the primary inflation gauge tracked by the Federal Reserve in setting rate policy. It measures the month-over-month and year-over-year change in the price of a defined basket of consumer goods and services.
The market impact flows through two channels. First, a CPI print above consensus shifts rate expectations toward fewer cuts or additional hikes, which raises the discount rate applied to future earnings. Long-duration growth stocks are most sensitive to this shift – the mechanism is explained in Why Rising Interest Rates Hurt Growth Stocks. Second, persistent inflation signals that real consumer spending power is deteriorating, which creates headwinds for discretionary sectors.
Shelter costs are the largest single component of CPI. When shelter inflation is running above the headline trend, it often signals that CPI will remain elevated longer than consensus expects – a detail worth tracking in the data tables alongside the headline number.
Sector implications of a high CPI surprise:
- Technology and long-duration growth: negative through discount rate compression
- Energy and commodities: often positive, as inflation is partly driven by energy prices
- Financials: mixed – steeper yield curve can benefit banks, but tighter financial conditions create loan risk
- Consumer Discretionary: negative through spending power erosion
NFP – Non-Farm Payrolls
The monthly payrolls report is the broadest measure of US labour market health. It reflects the number of jobs added or lost across all non-agricultural sectors in the prior month.
NFP creates a conditional reaction depending on the prevailing economic narrative. In a growth-dominant regime, a strong payrolls print is risk-on – economic momentum is intact. In a recession-risk regime, a strong payrolls print can be risk-off – it signals the Fed will hold rates higher for longer. The same number produces opposite market reactions depending on the context.
Two components within the report carry more forward-looking signal than the headline number: average hourly earnings (wage inflation, which feeds into future CPI readings) and the unemployment rate trend. A headline beat paired with decelerating wage growth reads differently from a headline beat paired with accelerating wages.
Sector implications of a strong NFP surprise:
- Financials: positive – economic strength supports loan demand
- Consumer Discretionary: positive short-term through spending confidence
- Long-duration growth: negative if the print shifts rate cut expectations further out
- Defensives: mild negative as recession risk fades temporarily
FOMC – Federal Open Market Committee
FOMC meetings occur eight times per year. The market-moving content is rarely the rate decision itself – by the time the meeting concludes, the rate outcome has typically been priced in through Fed communications over the preceding weeks. The material information comes from three other sources: the updated dot plot (which shows where individual members expect rates to go), the statement language (specific word changes signal shifting policy bias), and the press conference (where the Chair's tone and responses to questions shape forward expectations).
Three phrases carry the most weight in FOMC communications. "Restrictive" signals continued tightening bias. "Higher for longer" signals that cuts are not imminent even if hikes have paused. "Data-dependent" signals genuine uncertainty – the next release becomes more market-moving because it shapes the next meeting. Understanding which phrase dominates the post-meeting commentary determines the sector rotation implied by the decision.
The V.L.T. Model: Three Phases After Every Release
Markets move through a consistent three-phase structure after major economic releases. The phases are driven by different participants with different objectives, and each requires a different response.
Phase V – Volatility (0 to 5 Minutes)
The first five minutes after a release are dominated by algorithmic responses executing pre-programmed trades based on the deviation from consensus. Bid-ask spreads widen significantly as market makers pull liquidity. Stop-loss orders below obvious price levels get triggered. The initial price move frequently overshoots the information content of the data.
This phase is not actionable for directional trades. The spread widening means entries occur at significantly worse prices than the displayed quote. The stop hunt dynamic means the first move is frequently reversed within minutes. Position sizing calculations made on pre-release volatility estimates become meaningless when realised volatility is two to three times higher.
The appropriate response during Phase V is observation only.
Phase L – Liquidity (5 to 20 Minutes)
As the algorithmic response settles, the market enters a consolidation phase where liquidity begins returning but directional conviction has not yet formed. False breakouts from the initial spike range are common during this phase as different participant groups attempt to establish positions.
Fakeouts during Phase L are the second most common source of retail losses after Phase V entries. The price may appear to be forming a clear direction, but volume is typically insufficient to confirm institutional participation. Without volume confirmation, apparent breakouts frequently reverse as soon as the next layer of liquidity enters at a different price.
Observation continues through Phase L. The analysis work during this window is determining whether the deviation was large enough to produce a sustained directional move, which sectors the data most directly affects, and where the key structural price levels are that would confirm institutional direction.
Phase T – Trend (20 Minutes and Beyond)
From approximately 20 minutes after the release, institutional direction begins to form in price structure and volume. The initial volatility has cleared. Spreads have normalised. Participants with a genuine view on the data are now expressing it through sustained buying or selling rather than algorithmic responses.
This is where the V.L.T. Framework identifies the actionable window. Three conditions signal that Phase T has established:
- Price has formed a clear structure above or below the post-release range with at least two higher lows (upside) or lower highs (downside)
- Volume on the directional move is at least 30% above the pre-release average for that time of day (some traders use approximately 1.3x as a general guideline), indicating institutional participation
- The move is consistent with the sector implications of the deviation – a high CPI print producing sustained selling in technology and sustained strength in energy is confirming. A high CPI print producing a rally in technology is a signal that the data was already priced in.
Deviation Trading: How to Read the Surprise
The size of the deviation from consensus determines the likely magnitude of the subsequent move. Small deviations produce choppy, mean-reverting price action. Large deviations produce sustained directional moves through Phase T.
| Deviation Size | Typical Market Response | V.L.T. Implication |
|---|---|---|
| In-line with consensus (±0.1%) | Minimal reaction; choppy | Often no Phase T trade available |
| Small surprise (±0.1–0.3%) | Moderate initial move, partial reversal | Phase T may form but with limited follow-through |
| Significant surprise (±0.3–0.5%) | Strong initial move, sustained in Phase T | Higher probability Phase T setup |
| Large surprise (above ±0.5%) | Major move; regime implications | High probability Phase T; also check for regime reclassification |
The regime context matters for interpreting any given deviation. In a Selective Risk-Off environment, a high CPI surprise carries more market-moving weight than the same deviation in a Full Risk-On environment, because rate sensitivity is already elevated and institutional positioning is more defensive. This regime-dependent interpretation connects the economic calendar framework directly to the Market Regime Identification Framework.
Sector Rotation: The Strategic Layer
Economic releases affect sectors differently. Identifying which sectors the data most directly impacts – and whether the move is consistent with those implications – is what separates a structured approach from simply trading the index.
| Data Event | Surprise Direction | Sector Beneficiaries | Sector Headwinds |
|---|---|---|---|
| CPI | Higher than expected | Energy, Materials, Value | Technology, Growth, Consumer Discretionary |
| CPI | Lower than expected | Technology, Growth, REITs | Energy (if demand-driven inflation) |
| NFP | Stronger than expected | Financials, Consumer Discretionary | Long-duration growth (rate cut expectations reduced) |
| NFP | Weaker than expected | Defensives, Rate-sensitive growth | Financials, Cyclicals |
| FOMC | Hawkish surprise | Energy, Financials, USD | Technology, Emerging markets, Gold |
| FOMC | Dovish surprise | Technology, Growth, Gold | USD, Financials (short-term) |
This sector mapping connects directly to the Sorting Hat framework. A high CPI release creates an environment where Ravenclaw (commodity cyclicals) benefits and Gryffindor (long-duration growth) faces headwinds. The framework makes this rotation predictable rather than reactive.
Execution Rules During Economic Releases
Four rules apply to execution around all major economic releases.
Use limit orders only. Market orders during Phase V and Phase L can execute at prices significantly worse than displayed quotes due to spread widening. Limit orders define the entry price before submission; if the limit is not filled, the trade is skipped – that outcome is often preferable to a market order fill at an adverse price.
Reduce position size. Realised volatility during economic releases is typically two to four times higher than normal session volatility. Standard position sizing that accounts for normal volatility can produce oversized risk during news events. Reducing to 40–50% of normal size is a common way to keep risk per trade consistent with non-event sessions.
Wait for Phase T before entry. The 20-minute threshold is the minimum. In some sessions, particularly around FOMC press conferences, the directional move may not form cleanly until 30–45 minutes after the statement release as the Chair's responses unfold. The threshold is a floor, not a fixed target.
Define the invalidation level before entry. Phase T setups often have a clear structural level that confirms whether the thesis is correct. For an upside setup, that level is the last significant low before the breakout. If price returns to that level, the institutional direction thesis is considered incorrect and the position would typically be closed.
When Not to Trade Around Economic Data
Several conditions produce environments where the V.L.T. Framework identifies no actionable Phase T setup.
Small deviations from consensus produce choppy, non-directional Phase T behaviour. When the deviation is within the typical data revision range – often ±0.1% for CPI or ±25,000 for NFP – the market frequently treats the data as confirming existing expectations rather than new information.
Mixed signals within a single report reduce directional clarity. A headline NFP beat paired with downward revisions to the prior two months and decelerating wage growth produces competing narratives. The market frequently oscillates rather than trending.
Wide bid-ask spreads that persist beyond Phase V indicate that market makers remain uncertain about fair value. Trading in this environment means executing at a structural disadvantage.
No clear post-release price structure – where Phase L produces neither a clear range nor a directional lean – suggests the data was already priced in. When markets are efficient at anticipating data, the release produces noise rather than trend.
In these conditions, remaining flat through the release and returning to the standard daily analysis process is the structured response.
How Economic Events Feed Back Into Regime Classification
Every major economic release is a potential regime transition event. A CPI print significantly above consensus can shift the market from Selective Risk-On to Selective Risk-Off within a single session by repricing rate expectations. An unexpectedly weak NFP, as occurred in February 2026 with the 92,000 jobs decline, can accelerate a transition already underway.
This feedback loop means economic calendar analysis is not separate from the Daily Market Analysis Framework – it is an input into the Step 1 macro classification that runs every morning. The session after a major release requires the regime checklist to be rerun from scratch before any positions are sized.
Key Takeaways
| Concept | Summary |
|---|---|
| Core principle | Markets react to deviation from consensus, not the data itself |
| Phase V (0–5 min) | Algorithm-driven; spread widening; stop hunts – observe only |
| Phase L (5–20 min) | Consolidation; fakeouts common – observe and analyse |
| Phase T (20+ min) | Institutional direction forms – only actionable window |
| Phase T confirmation | Price structure + volume at 1.3x pre-release average + sector consistency |
| Deviation threshold | Surprises above ±0.3% produce higher-probability Phase T setups |
| Execution rules | Limit orders only; 40–50% position size; define invalidation level before entry |
| No-trade conditions | Small deviation; mixed signals; wide spreads; no post-release structure |
| Regime feedback | Major releases can trigger regime reclassification – rerun the checklist the following session |
Go Deeper: Breakout Bulletin Trading Frameworks Series
- How to Read the Stock Market Like a Professional: The 5-Layer Trading Framework – Master guide to the full trading framework
- Market Regime Identification Framework – How economic releases feed into regime classification
- Daily Market Analysis Framework – The five-step process this framework plugs into
- Risk-On vs Risk-Off Markets Explained – How CPI and NFP surprises drive regime transitions
- The Sorting Hat for Stocks – How macro environments map to stock groups
- Why Rising Interest Rates Hurt Growth Stocks – The CPI-to-rate-to-valuation transmission mechanism
This article is published by BreakoutBulletin for educational purposes only. It does not constitute investment advice or a recommendation to buy or sell any security. All trading frameworks, timing windows, and position sizing guidelines are provided for illustrative and educational purposes only. Economic data trading carries significant risk including the risk of substantial loss. Past performance is not indicative of future results. BreakoutBulletin is an educational content platform and is not a registered investment advisor, broker-dealer, or financial institution.
Go Deeper: Breakout Bulletin Trading Frameworks Series
- How to Read the Stock Market Like a Professional: The 5-Layer Trading Framework – Master guide to the full trading framework
- Market Regime Identification Framework – How economic releases feed into regime classification
- Daily Market Analysis Framework – The five-step process this framework plugs into
- Risk-On vs Risk-Off Markets Explained – How CPI and NFP surprises drive regime transitions
- The Sorting Hat for Stocks – How macro environments map to stock groups
- Why Rising Interest Rates Hurt Growth Stocks – The CPI-to-rate-to-valuation transmission mechanism
This article is published by BreakoutBulletin for educational purposes only. It does not constitute investment advice or a recommendation to buy or sell any security. All trading frameworks, timing windows, and position sizing guidelines are provided for illustrative and educational purposes only. Economic data trading carries significant risk including the risk of substantial loss. Past performance is not indicative of future results. BreakoutBulletin is an educational content platform and is not a registered investment advisor, broker-dealer, or financial institution.