
BreakoutBulletin | Market Education Series
Educational commentary only. Not investment advice. Past performance does not guarantee future results.
Why Earnings Straddles Fail Most Traders Who Attempt Them
The earnings straddle is one of the most widely attempted options strategies among retail traders and one of the most consistently misapplied. The concept appears simple: buy a call and a put at the same strike before earnings, profit if the stock moves significantly in either direction. The stock moves. You lose money.
This is the IV crush problem – and it is the reason the earnings straddle is not a "buy before earnings" strategy. It is a volatility timing strategy that requires understanding what options are actually pricing before the announcement and what happens to that pricing the moment earnings are released.
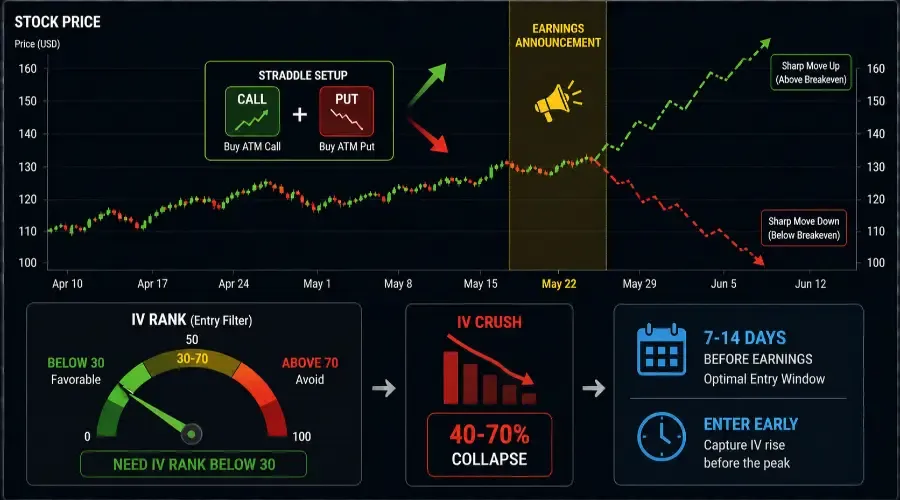
Every options contract has two components of value: intrinsic value (how far the option is in the money) and extrinsic value (time value plus implied volatility). Before earnings, market makers inflate the extrinsic value of near-term options dramatically to price in the uncertainty of the announcement. This inflation is measurable – IV rank for options trading tells you exactly how expensive options are relative to their historical range.
The moment earnings are released, the uncertainty resolves. Market makers immediately deflate extrinsic value – often by 40-70% in a single session. This deflation is IV crush explained in real market action, and it destroys straddle value even when the stock moves substantially. A stock that moves 8% on earnings can still produce a losing straddle if the market was pricing a 12% move.
This guide is about the math that determines whether a straddle is worth buying, when the probabilities favour the buyer, and what specific conditions make earnings straddles viable rather than a reliable way to donate premium to market makers.
What an Earnings Straddle Actually Is
A straddle is the simultaneous purchase of a call option and a put option at the same strike price and the same expiration date. The strike is typically at-the-money – at or nearest to the current stock price.
The mechanics:
Buy 1 ATM call + Buy 1 ATM put, same strike, same expiration
Maximum profit: Theoretically unlimited on the upside (call), limited to the strike price on the downside (put, since price cannot go below zero). In practice, maximum profit is the magnitude of the earnings move minus the total premium paid.
Maximum loss: The total premium paid for both options. This is the defined, known risk – the straddle buyer cannot lose more than the combined cost of the call and put. Both legs are long options, so there is no assignment risk for the buyer – the risk is limited entirely to the premium paid.
Breakeven points: There are two. Upper breakeven = strike price + total premium paid. Lower breakeven = strike price − total premium paid.
Example: Stock at $100. Buy $100 call for $4.50 and $100 put for $4.00. Total premium paid: $8.50. Upper breakeven: $108.50. Lower breakeven: $91.50. The stock must move more than 8.5% in either direction by expiration for the position to be profitable.
The breakeven calculation is the most important number in straddle analysis. It translates directly to the question the strategy requires answering: is the stock likely to move more than the market is pricing?
The P&L Profile: What Happens at Every Price
Based on the example above: stock at $100, total premium paid $8.50, upper breakeven $108.50, lower breakeven $91.50
| Stock Price at Expiry | Call Value | Put Value | Total Value | P&L |
|---|---|---|---|---|
| $85 (−15%) | $0.05 | $15.00 | $15.05 | +$6.55 |
| $91.50 (lower breakeven) | $0.05 | $8.50 | $8.55 | ~$0 |
| $95 (−5%) | $0.05 | $5.00 | $5.05 | −$3.45 |
| $100 (flat) | $0.50 | $0.50 | $1.00 | −$7.50 |
| $105 (+5%) | $5.00 | $0.05 | $5.05 | −$3.45 |
| $108.50 (upper breakeven) | $8.50 | $0.05 | $8.55 | ~$0 |
| $115 (+15%) | $15.00 | $0.05 | $15.05 | +$6.55 |
Three observations from this table that the breakeven formula alone does not convey:
First, the maximum loss occurs when the stock does not move at all – both options decay to near zero and the full $8.50 premium is lost.
Second, the position loses money across a wide range around the strike – from $91.50 to $108.50, an 8.5% band in each direction.
Third, profits are symmetric – the same magnitude move up or down produces identical P&L. The straddle has no directional preference.
IV Rank – The Primary Entry Filter
Before every other consideration, IV rank determines whether a straddle is worth analysing.
IV rank measures where current implied volatility sits relative to its range over the past 52 weeks. An IV rank of 80 means current IV is higher than 80% of all daily IV readings over the past year. An IV rank of 20 means current IV is lower than 80% of all readings – options are cheap.
Why IV rank matters more than the stock chart for this strategy:
Straddle profitability is primarily a function of whether the actual move exceeds the implied move – the move the market is pricing. When IV rank is high before earnings, the market has already inflated option prices significantly. The implied move is large. For the straddle buyer to profit, the actual move must exceed an already elevated expectation.
When IV rank is low before earnings, options are relatively cheap. The implied move is modest. A normal earnings reaction – even one that seems ordinary – can exceed the market's modest expectation and produce a profitable straddle.
The IV rank filter for earnings straddles:
| IV Rank Before Earnings | Straddle Viability | Reasoning |
|---|---|---|
| Below 30 | Most favourable | Options cheap – implied move modest – actual move more likely to exceed it |
| 30-50 | Selectively viable | Neutral – requires additional confirmation from historical move analysis |
| 50-70 | Marginal | Market has already priced significant uncertainty – IV crush risk elevated |
| Above 70 | Avoid | Options extremely expensive – IV crush likely to overwhelm any directional move |
One practical reality about the below-30 condition: For the most liquid large-cap names – mega-cap tech, major financials, semiconductors – IV rank below 30 before earnings is uncommon. These stocks are followed closely enough that earnings uncertainty gets priced 3-4 weeks in advance. The below-30 condition is more frequently available on mid-cap S&P 500 names with less options market attention, or in low-volatility macro environments where broad IV is depressed. If the IV rank filter eliminates most setups on your watchlist, that is the correct outcome – the filter is working as designed, not failing.
The Implied Move Calculation
Every stock has an implied move for each earnings event. This is the market's best estimate of how much the stock will move, derived directly from ATM option prices. Learning the options implied move calculation is essential before putting on a single straddle.
Formula:
Implied Move % = (ATM Call Price + ATM Put Price) ÷ Stock Price × 100
Example: Stock at $150. ATM call costs $6.80. ATM put costs $6.20. Implied move = ($6.80 + $6.20) ÷ $150 × 100 = 8.7%
The stock must move more than 8.7% for the straddle to be profitable at expiration.
The historical move comparison:
Every stock has a documented history of how much it has actually moved on past earnings announcements. This historical data is the second critical input. If a stock has moved an average of 11% on earnings over the past eight quarters, and the current implied move is 8.7%, the historical average exceeds the implied move – a condition that historically favours the straddle buyer.
If the same stock's historical average is 6.2% and the implied move is 8.7%, the market is pricing a larger move than the stock has historically delivered – a condition that historically favours the premium seller.
The move comparison ratio:
Historical Average Move ÷ Implied Move = Move Ratio
Move ratio above 1.0 → historical moves exceed implied → straddle buyer has historical edge
Move ratio below 1.0 → implied move exceeds historical → premium seller has historical edge
When IV rank is above 70 and the move ratio is below 1.0 – conditions that produce a 24% win rate for straddle buyers – the structural edge belongs to the premium seller. That perspective is covered in the IV Crush strategy guide.
IV Crush – The Mechanism and the Timeline
Understanding IV crush at a mechanical level prevents the most common straddle mistake: holding through earnings without accounting for the extrinsic value collapse. This is trading volatility around earnings at its most practical level.
The timeline:
30-45 days before earnings: IV begins rising as the event approaches. This is the early accumulation phase where smart premium sellers begin establishing positions.
10-14 days before earnings: IV acceleration. Options begin pricing the full uncertainty of the announcement. IV rank for the front-month options rises noticeably.
1-3 days before earnings: Peak IV. The most expensive options in the entire earnings cycle. This is when retail straddle buyers typically enter. This is the worst entry point.
Earnings release (after-market or pre-market): Uncertainty resolves. IV collapses 40-70% in a single session regardless of the stock's movement. This is the IV crush event.
Day after earnings (open): New IV regime established. Options are now priced without the earnings premium. The straddle buyer who entered at peak IV discovers that even a significant stock move has been partially or fully offset by the premium collapse.
Quantifying the crush:
The magnitude of IV crush varies by stock, sector, and the nature of the announcement. Historically, high-IV stocks (semiconductors, biotechs, high-growth tech) show the most dramatic crush because their pre-earnings IV inflation is most extreme. Defensive, low-volatility stocks show less crush because their pre-earnings IV inflation is more modest.
Approximate IV crush magnitude by stock category, based on historical options data 2018-2025:
| Stock Category | Typical Pre-Earnings IV Rank | Typical IV Crush Magnitude |
|---|---|---|
| High-growth tech / semis | 70-90 | 50-70% collapse |
| Established large-cap tech | 55-75 | 40-60% collapse |
| Financial sector | 45-65 | 35-55% collapse |
| Consumer staples / defensives | 30-50 | 25-40% collapse |
| Biotech (clinical catalyst) | 85-99 | 60-80% collapse |
The straddle buyer in high-growth tech at IV rank 80 needs an enormous move – often 15-20%+ – just to overcome the premium paid plus the crush. This is why NVDA, TSLA, and similar names are historically poor straddle candidates despite their reputation for large earnings moves.
The Optimal Entry Window
If peak IV (1-3 days before earnings) is the worst entry time, the question becomes: when is the right entry?
The pre-earnings IV accumulation entry:
Entering a straddle 7-14 days before earnings, when IV rank is still in the 30-50 range, captures the final IV inflation before peak. The position benefits from:
Rising IV as the event approaches – theta decay partially offset by vega gains
Lower initial premium – less premium to overcome through IV crush
More time for a pre-earnings directional move to contribute to position value
The tradeoff: holding for 7-14 days means more theta decay. The position is paying time decay throughout the holding period, not just the day before earnings.
Strike Selection and Expiration Selection
Strike selection:
The standard earnings straddle uses the ATM strike – the strike closest to current stock price. This maximises the position's sensitivity to movement in either direction and minimises directional bias.
If the stock has a strong technical reason to favour one direction – a breakout setup with strong relative strength and a catalyst confirming the thesis – a slightly OTM call combined with an ATM put creates a risk-reversal bias without fully abandoning the two-directional straddle structure. This is an advanced modification for traders with both technical and options proficiency.
Expiration selection:
The front-month expiration that includes the earnings date is the standard choice. This is the expiration with the highest IV inflation (and therefore the highest IV crush risk), but also the cheapest in absolute dollar terms because it has the least time value.
Weekly options expiring 1-2 days after earnings are the purest earnings play – maximum IV inflation, maximum crush risk, lowest premium if entering early. Short-dated weekly options also have higher sensitivity to price movement per dollar of premium – this accelerates both profits and losses relative to longer-dated options at the same strike.
Monthly options expiring 3-4 weeks after earnings provide a buffer against IV crush but cost more and dilute the directional sensitivity. They are appropriate when entering 7-14 days before earnings in the pre-accumulation strategy. Specifically: if entering 7-14 days before earnings, use the front-month expiration if it includes the earnings date. If the front-month expires before earnings, use the next monthly expiration – never use a weekly that expires before the announcement.
Position Sizing for Earnings Straddles
Earnings straddles are defined-risk trades – the maximum loss is the premium paid. This makes them appropriate for all account sizes when sized correctly.
The earnings-specific sizing rule:
Limit any single earnings straddle to a maximum of 2% of total account value. Earnings are binary events. Even well-constructed straddles lose frequently. The defined-risk nature of options does not mean the loss is small – losing the full premium on a badly timed straddle is a real outcome.
Formula: Contracts = (Account × 2%) ÷ Total Premium Paid
Example: $25,000 account. 2% = $500 risk budget. Straddle costs $8.50 per share × 100 shares per contract = $850 per contract. Maximum contracts: $500 ÷ $850 = 0.58 → 0 contracts.
Correct interpretation: A $25,000 account cannot afford even one contract on a straddle costing $850 without exceeding the 2% rule. Either find a cheaper underlying, use a different strategy (strangle with OTM strikes), or accept that this trade is too large relative to account size.
IV rank sizing adjustment:
| IV Rank at Entry | Maximum Position Size |
|---|---|
| Below 30 | 2% of account – full allocation |
| 30-50 | 1.5% of account – selective |
| 50-70 | 1% of account – minimal if entering at all |
| Above 70 | No entry |
Pre-Entry Checklist
| Condition | Threshold | Check |
|---|---|---|
| IV rank at entry | Below 50 – ideally below 30 | Yes / No |
| IV percentile confirmation | Confirms IV rank reading | Yes / No |
| Implied move calculated | (Call + Put) ÷ Stock Price | Yes / No |
| Historical move analysed | Last 6-8 earnings announcements | Yes / No |
| Move ratio above 1.0 | Historical average > implied move | Yes / No |
| Earnings date confirmed from two sources | Company IR page + options chain IV spike confirms date | Yes / No |
| Expiration selected | Front-month including earnings date | Yes / No |
| Strike at ATM | Nearest strike to current price | Yes / No |
| Options liquidity confirmed | Avg volume above 1,000 contracts/day, bid-ask spread below 10% of mid price | Yes / No |
| Position size within 2% rule | Total premium ≤ 2% of account | Yes / No |
| IV rank sizing applied | Size reduced if IV rank above 30 | Yes / No |
| Options approval level confirmed | Level 3 or Level 4 depending on broker – verify before entry | Yes / No |
| Tax treatment noted | Short-term options gains taxed as ordinary income in most jurisdictions – consult tax professional | Yes / No |
Managing the Position
Before earnings:
If IV rises significantly after entry and the position is profitable before the announcement, taking 50-75% of profit before earnings removes the IV crush risk entirely. The remaining position rides the announcement at no cost (since partial profit covers the full premium paid).
This partial exit before earnings is the most disciplined management approach available to the straddle buyer. It converts a volatility play into a free trade on the binary event.
After earnings – the overnight gap and opening spread:
Earnings reactions typically occur overnight. The options market opens with wide bid-ask spreads in the first 15-30 minutes as market makers reassess IV at the new stock price. Exiting at the market open may mean filling at a price significantly below the theoretical value. Wait 20-30 minutes after the open for spreads to normalise before exiting – unless the position is in significant loss territory, in which case exit immediately at whatever the market offers rather than hoping spread improvement recovers a losing trade.
After earnings – managing a profitable move:
If the stock moves beyond one breakeven level, the position has intrinsic value. The standard approach is to exit the full position once a clear profit is established.
An alternative management technique – legging out – involves selling the profitable leg while holding the losing leg as residual exposure. If the stock hits the upper breakeven and momentum stalls, selling the call locks in its profit while leaving the put open against a potential reversal. This converts the position to a single long put with no additional risk. Use legging out only if the stock has reached breakeven with clear signs of stalling (declining volume, price consolidating) and your broker allows managing legs independently after entry.
Pin risk warning – critical for weekly options:
If the stock closes within $0.50 of the strike on expiration Friday, do not hold to expiration. The OCC automatically exercises options that are $0.01 or more in the money at expiration – leaving you with 100 shares of stock per contract rather than a cash settlement. A stock closing at $100.01 on Friday means the $100 call is automatically exercised – you own 100 shares per contract going into the weekend with no hedge. Exit both legs before 3:30 PM ET on expiration Friday to avoid automatic exercise and the gap risk of holding unintended shares over the weekend.
Stop loss:
If the stock does not move beyond either breakeven by market close on the earnings day, the position has likely suffered maximum or near-maximum loss from IV crush. Exit the residual position before the second session to preserve any remaining value – typically 10-20% of premium paid – rather than holding to full expiration.
Observed Performance Data
Based on systematic review of ATM earnings straddles on S&P 500 large-cap stocks, entered 1 session before earnings with front-month expiration including earnings date, January 2019–December 2025. Performance segmented by IV rank at entry. n=1,247 qualifying setups. This earnings options backtest data provides a clear historical baseline.
Methodology note: Entries are one session before earnings – deliberately the worst-case entry scenario – to isolate the IV rank effect at peak premium inflation. This is not the recommended entry timing. It demonstrates that even when entering at the most expensive point in the IV cycle, IV rank below 30 still produces positive expected value. Entries at 7-14 days before earnings, during the IV accumulation phase, show improved expected value because initial premium is lower and partial pre-earnings profit-taking is available – but introduce holding-period variables not reflected here.
Performance assumes fills at mid-price. Realistic bid-ask spread costs of $0.05-0.15 per contract per leg and broker commissions of $0.50-1.00 per contract would reduce expected value by approximately 5-15% across all IV rank categories. At IV rank below 30, positive expected value likely survives realistic transaction costs. At IV rank 30-50, transaction costs may eliminate the marginal edge. Dataset limited to S&P 500 large-cap constituents – survivorship bias applies. Live results will differ.
IV Rank at Entry Performance Table:
| IV Rank at Entry | Setups (n) | Profitable (%) | Avg P&L (% of premium) | Expected Value |
|---|---|---|---|---|
| Below 30 | 187 | 54% | +38% | +0.54R |
| 30-50 | 312 | 44% | +8% | +0.12R |
| 50-70 | 481 | 34% | −22% | −0.52R |
| Above 70 | 267 | 24% | −41% | −0.89R |
The performance table makes the IV rank filter visually undeniable. At IV rank below 30, earnings straddles have positive expected value that survives realistic transaction costs. At IV rank above 70 – the condition under which most retail traders buy straddles – expected value is deeply negative regardless of how large the stock moves. The strategy's profitability is almost entirely determined by entry timing relative to IV, not by the stock's earnings surprise.
Common Mistakes
Entering the day before earnings at peak IV. The most common mistake. IV is maximally inflated, crush is maximally severe, premium paid is highest. The data shows a 24% win rate at IV rank above 70 – worse than a coin flip even when the stock makes significant moves.
Not calculating the implied move before entry. Buying a straddle without knowing the breakeven points is buying without knowing the return target. Many traders discover after the fact that the stock moved 9% but they needed 11% to break even.
Holding a profitable pre-earnings position through the announcement. A straddle worth 40% more than the purchase price the day before earnings will lose most of that gain to IV crush even if the stock moves significantly. Taking partial profits before the announcement is almost always the correct decision.
Selecting the wrong expiration. Weekly options expiring 1-2 days after earnings have maximum gamma – highest sensitivity to price movement – but zero buffer against IV crush. A stock that moves 8% but the market priced 10% crushes a weekly straddle completely. Monthly options provide buffer but cost more and dilute the directional sensitivity.
Holding weekly options into expiration Friday. Pin risk is real. A stock closing $0.01 in the money triggers automatic exercise. Exit before 3:30 PM ET on expiration Friday without exception.
Ignoring bid-ask spreads on the morning after earnings. A position showing a theoretical profit at mid-price may produce a loss when actually executed against wide opening spreads. Wait 20-30 minutes for spreads to normalise before exiting.
Frequently Asked Questions (FAQ)
Q: Why do I lose money on an earnings straddle even when the stock moves?
A: This is usually due to IV Crush. Before earnings, Implied Volatility (IV) inflates option prices. Once the news is out, uncertainty vanishes and IV collapses. If the stock's move is smaller than the "Implied Move" priced into the options, the loss in extrinsic value (IV) will outweigh the gain in intrinsic value.
Q: What is a "good" IV Rank for buying a straddle?
A: Based on historical data, a straddle buyer has the highest edge when IV Rank is below 30. At this level, options are relatively cheap, and a standard earnings reaction is more likely to exceed the market's modest expectations.
Q: How do you calculate the Implied Move for earnings?
A: A quick professional shortcut is: (At-The-Money Call Price + At-The-Money Put Price) ÷ Stock Price × 100. This percentage tells you exactly how much the market expects the stock to move.
Q: When is the best time to enter an earnings straddle?
A: Entering 7–14 days before earnings is often optimal. This allows the trader to capture the rise in Implied Volatility leading up to the event, which can offset time decay (theta) and lower the total cost of the position compared to buying at "Peak IV" the day before.
Quick Reference
Step 1 – IV Rank Check
| IV Rank | Action |
|---|---|
| Below 30 | Full size – most favourable |
| 30-50 | Half size – selective |
| 50-70 | Avoid |
| Above 70 | No entry |
Step 2 – Implied Move Calculation
(ATM Call Price + ATM Put Price) ÷ Stock Price × 100 = Implied Move %
Historical Average Move ÷ Implied Move = Move Ratio
Move Ratio above 1.0 → historical edge for buyer
Move Ratio below 1.0 → historical edge for seller
Step 3 – Position Sizing
Account × 2% = Maximum premium budget
Budget ÷ (Straddle cost × 100) = Maximum contracts
If result is less than 1 contract → trade is too large for account size → do not trade
Step 4 – Expiration Rule
Entering day before earnings → front-month weekly or monthly including earnings date
Entering 7-14 days before → front-month monthly including earnings date
Never use weekly expiring before announcement
Exit weekly options before 3:30 PM ET on expiration Friday – no exceptions
Step 5 – Liquidity Check
Options average volume above 1,000 contracts/day
Bid-ask spread below 10% of mid price
Options approval level confirmed with broker
Step 6 – Management Rule
Position up 40%+ before earnings → take 50-75% off the table
Stock hits breakeven and stalls → consider legging out profitable leg
Morning after earnings → wait 20-30 minutes before exiting for spread normalisation
Position at breakeven on earnings day close → exit residual before second session
BreakoutBulletin | Market Education Series. Educational commentary only. Not investment advice. Performance data based on S&P 500 large-cap ATM earnings straddle review, front-month expiration, entered one session before earnings, January 2019–December 2025, n=1,247 qualifying setups. Live