
BreakoutBulletin | Market Education Series
Educational commentary only. Not investment advice. Past performance does not guarantee future results.
If you've ever looked at an earnings calendar and thought, "I have no idea which way this stock will move, but I'm pretty sure it won't go far" – the butterfly spread might be exactly what you're looking for. It's not as well-known as the straddle or iron condor, but for the right environment – moderate IV, an implied move that historically overshoots reality, and a specific price target – it offers the highest reward-to-risk ratio in the entire options cluster.
Let's walk through how it works, when to use it, and how to manage it.
What the Butterfly Does That No Other Earnings Structure Does
Every earnings options structure in this cluster is built around one of two assumptions: the stock will move significantly (straddle, strangle) or the stock will stay contained while volatility collapses (calendar spread, iron condor). The butterfly spread belongs to the second category – but with a structural difference that makes it the most precisely targeted earnings structure in the entire framework.
The calendar spread profits when the stock stays near the strike across two expirations, capturing IV differential. The iron condor profits across a wide band between two short strikes. The butterfly profits within a narrow, precisely defined zone – maximum profit occurs exactly at the centre strike – but does so entirely within a single expiration using a defined-profit, defined-risk three-strike structure.
This precision is the butterfly's defining characteristic and its primary limitation simultaneously. No other single-expiration earnings structure generates its maximum profit when the stock moves exactly to a predetermined price. That specificity makes the butterfly the earnings structure to use when you have a specific price target in mind – not just a view that the stock will stay contained, but a view that it will close near a particular level.
The Construction: Three Strikes, One Expiration
A long call butterfly combines three strikes at equal intervals, all in the same expiration:
Buy 1 lower strike call
Sell 2 middle strike calls (the body)
Buy 1 higher strike call (the wing)
The position is net debit – cheaper than a straddle because the two short middle calls offset most of the cost of the two long calls.
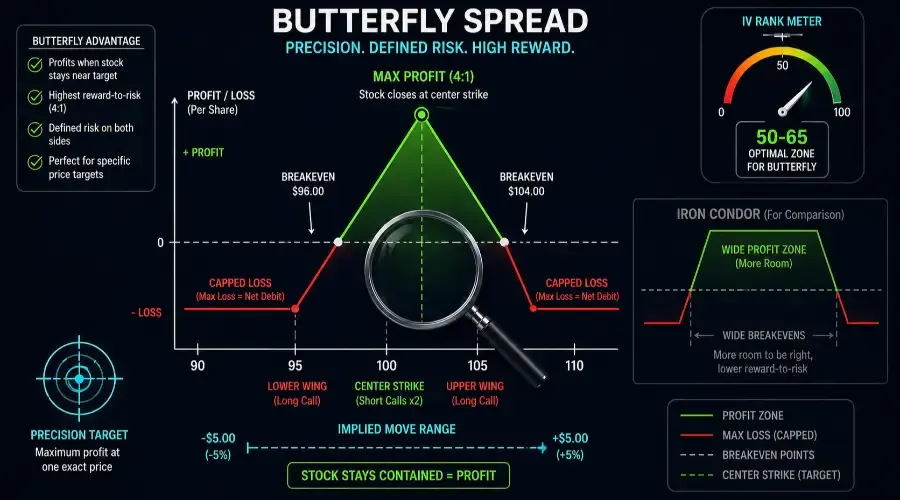
Example: Stock at 100 before earnings. Buy 1 95 call, sell 2 100 calls, buy 1 105 call, all expiring after earnings. Lower call costs 6.50. Each middle call collected 3.50 (×2 = 7.00). Upper call costs 1.50. Net debit: 6.50 + 1.50 − 7.00 = 1.00 per share ($100 per contract).
Maximum profit: Strike width minus net debit, achieved at the centre strike at expiration.
Example: 5.00 − 1.00 = 4.00 per share (400 per contract) if stock closes exactly at $100.
Maximum loss: Net debit paid – 1.00 per share (100 per contract). Occurs if the stock closes at or beyond either outer strike.
Breakeven points:
Upper breakeven = centre strike + (max profit per share)
Lower breakeven = centre strike − (max profit per share)
Example: Upper breakeven 104.00. Lower breakeven 96.00. Stock must close between 96 and 104 for any profit.
The risk-reward profile: The butterfly risks 100 to make 400 – a 4:1 maximum reward-to-risk ratio. This is the highest maximum reward-to-risk of any strategy in the Options cluster. However, maximum reward requires the stock to close exactly at the centre strike – a precise outcome that produces the 4:1 payoff only at a single point.
The P&L Profile: What Happens at Every Price
Based on example above: net debit 1.00, centre strike 100, breakevens 96 and 104.
| Stock Price at Expiry | Position P&L |
|---|---|
| $90 (−10%) | −$1.00 (max loss) |
| $95 (lower long strike) | −$1.00 (max loss) |
| $96 (lower breakeven) | $0 |
| $98 (−2%) | +$2.00 |
| $100 (flat – max profit) | +$4.00 |
| $102 (+2%) | +$2.00 |
| $104 (upper breakeven) | $0 |
| $105 (upper long strike) | −$1.00 (max loss) |
| $110 (+10%) | −$1.00 (max loss) |
Three observations this table reveals:
First, the maximum loss is identical regardless of how far the stock moves beyond the outer strikes. A 3% move and a 20% move both produce the same −$1.00 loss. The butterfly has the most forgiving tail risk profile of any earnings structure - the maximum loss is capped at the small net debit regardless of the magnitude of an adverse move.
Second, the profit zone (96 − 104) is narrower than the iron condor's band but wider than it appears – the stock can move 4% in either direction and the position remains profitable. For stocks with historical earnings moves below 5%, this range is meaningful.
Third, the 4:1 reward-to-risk profile reverses the iron condor's asymmetry. The iron condor risks more than it makes per unit; the butterfly makes more than it risks per unit. The tradeoff is probability - the butterfly's win rate is lower because maximum profit requires a precise outcome.
IV Rank: The Butterfly's Unique Position
The butterfly occupies an unusual position in the IV rank framework that distinguishes it from every other earnings strategy.
The straddle and strangle benefit from low IV rank – cheap options make the debit cost manageable. The iron condor benefits from high IV rank – expensive options generate maximum premium collection. The butterfly benefits from moderate IV rank – typically 40-65.
Why moderate IV is optimal for butterflies:
At low IV rank (below 30), the implied move is modest and the butterfly's narrow profit zone relative to the expected move may actually encompass the stock's likely range - but the net debit is also low, making the position cheap. This sounds favourable but produces a different problem: low IV means minimal time value in the middle short calls, which reduces the premium collected from selling the body and makes the risk-reward less attractive.
At high IV rank (above 70), options are expensive. The butterfly's net debit is higher because the long wings cost more, while the short body calls only partially offset this cost. The position becomes expensive relative to its fixed maximum profit – the 4:1 reward-to-risk ratio compresses.
At moderate IV rank (40-65), option pricing produces the most efficient butterfly construction: enough IV in the body calls to generate meaningful premium credit, without the wing cost inflation that high IV creates.
| IV Rank Before Earnings | Butterfly Viability |
|---|---|
| Below 30 | Marginal – low debit but poor body premium |
| 30-50 | Selectively viable – good body credit, manageable wing cost |
| 50-65 | Most favourable – optimal construction efficiency |
| Above 65 | Marginal – wing cost inflation reduces reward-to-risk |
| Above 80 | Avoid – use iron condor instead |
The Implied Move as the Strike Selection Guide
Strike selection is the butterfly's most critical construction decision. Unlike the iron condor where short strikes are placed beyond the implied move, the butterfly's centre strike is placed at the expected closing price - the most likely landing zone after earnings.
The three-step strike selection process:
Step One: Calculate the implied move using the standard formula: (ATM Call + ATM Put) ÷ Stock Price × 100.
Step Two: Assess whether the stock is likely to move at or below the implied move. The butterfly profits when the stock closes near the centre strike – making it appropriate for stocks where the implied move historically overstates the actual move. Calculate the Move Ratio:
Move Ratio = Historical Average Move ÷ Implied Move
Historical Average Move defined: The average of the absolute percentage change (close to close) on the last 8 earnings announcements, excluding the current one. Calculate using the closing price the day before earnings and the closing price the day after.
A ratio below 0.80 - the implied move substantially exceeds historical average – is the primary signal that the stock tends to stay contained relative to market expectations.
Step Three: Set the centre strike. For most earnings butterflies, set the centre strike at the ATM level (the strike closest to the current stock price). Directional butterflies (centre strike off-ATM) require a high-conviction price target and are only for experienced traders comfortable with skewed risk. If technical analysis provides a clear, justified directional target and you have experience with asymmetric butterflies, you may adjust one increment. Otherwise, ATM is correct.
Strike width selection:
The strike width (distance between each consecutive strike) determines both the profit zone width and the maximum profit magnitude. Wider strikes produce a wider profit zone and higher maximum profit – but also higher net debit because the long wings are further OTM and more expensive relative to the body credit.
| Strike Width | Profit Zone (on $100 stock) | Max Profit per Contract | Net Debit (approximate) |
|---|---|---|---|
| $2.50 wide | Narrow – ±2% | $150 | $100 |
| $5.00 wide | Moderate – ±4% | $400 | $100 |
| $10.00 wide | Wide – ±8% | $900 | $100 |
The net debit remains approximately constant regardless of strike width for efficiently priced butterflies - the wider strikes produce proportionally more body credit that offsets the wing cost increase. The 5 and 10 wide strikes are more appropriate for earnings butterflies than the $2.50 wide, because they provide more profit zone buffer for the binary event uncertainty.
Liquidity warning for 5-wide strikes: On lower-priced stocks or those with wide bid-ask spreads, a 5-wide butterfly may have illiquid wings. Always check the average volume (above 500 contracts/day) and bid-ask spread of the outer strikes before trading. If the spread on either wing exceeds 20% of the net debit, consider a different underlying or wider strikes.
The Iron Butterfly: The Higher-Premium Variant
The iron butterfly sells ATM call and ATM put simultaneously while buying OTM call and put for protection – effectively a short straddle with defined risk added by the long wings. It is the highest-premium butterfly variant and the most appropriate when IV rank is in the 50-65 range.
Construction: Sell ATM call, sell ATM put, buy OTM call, buy OTM put – all same expiration.
The iron butterfly collects net premium rather than paying net debit. Maximum profit is the net premium collected, achieved when the stock closes exactly at the ATM strike. Maximum loss is the strike width minus premium collected.
Note on iron butterfly vs long call butterfly: The iron butterfly is a credit-based alternative. However, its P&L profile is not identical to a long call butterfly due to put-call skew (differences in implied volatility between calls and puts). For retail traders seeking simplicity and clarity, we recommend the long call butterfly for most earnings applications. If you choose the iron butterfly, verify the net credit and risk-reward with your specific broker's margin treatment.
For most retail traders, the long call butterfly is the preferred structure unless broker margin treatment makes the iron butterfly significantly more capital efficient.
Pre-Earnings Gamma and Vega Risk
Before earnings, if implied volatility rises further (e.g., from IV rank 50 to 70) or the stock drifts significantly toward one wing, the butterfly can lose value even before the announcement. This happens because the short body (two calls) has negative vega and negative gamma:
Negative vega: When IV increases, the short body calls increase in value faster than the long wings, reducing the position's net value.
Negative gamma: If the stock drifts toward the centre strike, gamma is low; if it drifts toward a wing, gamma becomes negative and the position loses value directionally.
For this reason, enter butterflies no more than 1-2 days before earnings – not earlier. Entering earlier exposes the position to pre-earnings IV expansion and directional drift without any offsetting benefit (unlike straddles, where earlier entry reduces cost).
Position Sizing
The butterfly's maximum loss is the net debit paid - typically $50-150 per contract on standard setups. This makes it the lowest absolute-risk single-contract earnings structure in the cluster.
Sizing formula: Maximum 3% of account per earnings butterfly.
The higher percentage versus the 2% straddle/strangle rule reflects the butterfly's lower absolute maximum loss. A 100 net debit butterfly risks less per contract than an 850 straddle – the 3% rule produces an appropriate absolute risk level.
Contracts = (Account × 3%) ÷ Net Debit Per Contract
Example: 15,000 account. 450 risk budget. Net debit 100 per contract. Maximum contracts: 450 ÷ $100 = 4 contracts.
IV rank sizing adjustment:
| IV Rank | Maximum Position Size |
|---|---|
| 50-65 (optimal zone) | 3% of account |
| 30-50 | 2% of account |
| Outside 30-65 | 1% or no entry |
Pre-Entry Checklist
| Condition | Threshold | Check |
|---|---|---|
| IV rank in optimal zone | 30-65 – ideally 50-65 | Yes / No |
| Implied move calculated | (ATM Call + ATM Put) ÷ Stock Price | Yes / No |
| Historical average move defined | Average of last 8 earnings moves (absolute %) | Yes / No |
| Move Ratio below 0.80 | Historical average move ÷ implied move | Yes / No |
| Centre strike selected | ATM for most traders; directional only with strong justification | Yes / No |
| Strike width appropriate | 5 or 10 wide for earnings events | Yes / No |
| Maximum profit calculated | (Strike width − net debit) × 100 per contract | Yes / No |
| Maximum loss confirmed | Net debit × 100 per contract | Yes / No |
| Profit zone verified | Centre strike ± max profit per share – fits historical move range | Yes / No |
| Net debit within 3% rule | Net debit × contracts ≤ 3% of account | Yes / No |
| Options liquidity confirmed | All three strikes: volume above 500 contracts/day | Yes / No |
| Bid-ask spread manageable | Three-leg execution – verify total spread cost below 15-20% of net debit | Yes / No |
| Earnings date confirmed from two sources | Company IR page + options chain confirms date | Yes / No |
| Options approval level confirmed | Level 3 or Level 4 depending on broker | Yes / No |
| Exit plan defined | Exit morning after earnings – not held to expiration | Yes / No |
| Tax treatment noted | Short-term gains taxed as ordinary income in most jurisdictions | Yes / No |
Managing the Butterfly After Earnings
The morning-after default exit:
Exit the butterfly position at market open on the first session after earnings – the same default as the calendar and iron condor. IV has reset overnight. The position's remaining value reflects only intrinsic value plus residual time value at the new stock price.
Wait 20-30 minutes after open for bid-ask spreads to normalise across all three strikes before exiting. Three-leg structures have compounding spread costs – exiting at the open when spreads are widest is particularly costly for butterflies.
If the stock closes at or near the centre strike:
This is the best-case scenario. The butterfly may be near maximum profit. Two choices: exit immediately at the open and capture the profit, or hold for an additional 1-2 sessions if the stock is showing no signs of continued movement and remains within 2% of the centre strike. The additional hold collects residual time decay on the short body calls. Close no later than 3 days after earnings regardless.
If the stock moves beyond the breakeven but within the outer strikes:
The position has some intrinsic value remaining. Exit at the open – do not hold hoping for reversion to the centre strike. The profit available is better taken than risked on further movement.
If the stock moves beyond the outer strikes:
Maximum loss is realised. Both long calls are OTM and the two short calls are approximately offset by the remaining long call value. The position is worth near zero. Exit immediately – there is no recovery scenario and no reason to pay additional time decay.
Pin risk:
If the stock closes within $0.50 of either outer strike on expiration Friday, exit all three legs before 3:30 PM ET. Automatic exercise of the long call with the short call just out of the money creates an unintended naked long stock position over the weekend.
Observed Performance Data
Based on systematic review of $5-wide long call butterflies on S&P 500 large-cap stocks, centre strike ATM, front-month expiration including earnings, entered 1-2 days before earnings, exited morning after earnings. Performance segmented by IV rank and Move Ratio. n=612 qualifying setups, January 2019-December 2025.
Methodology note: All positions exited morning after earnings – not held to expiration. Entries 1-2 days before earnings reflect the butterfly's optimal entry window – unlike straddles where earlier entry reduces IV cost, butterflies entered closer to earnings benefit from maximum body call premium relative to wing cost. Transaction costs for three-leg structures reduce expected value by approximately 15-20% due to three simultaneous bid-ask spreads. S&P 500 large-cap only – survivorship bias applies. Live results will differ.
| IV Rank / Move Ratio | Setups (n) | Win Rate | Avg P&L (% of max profit) | Expected Value |
|---|---|---|---|---|
| IV 50-65, Ratio <0.80 | 143 | 52% | +68% | +0.84R |
| IV 50-65, Ratio 0.80-1.0 | 98 | 41% | +32% | +0.31R |
| IV 30-50, Ratio <0.80 | 156 | 44% | +38% | +0.37R |
| IV 30-50, Ratio 0.80-1.0 | 112 | 34% | +12% | +0.08R |
| IV outside 30-65, All | 103 | 27% | −18% | −0.46R |
The IV rank 50-65 combined with Move Ratio below 0.80 produces the highest expected value – 0.84R before the 15-20% transaction cost reduction, leaving approximately 0.67-0.71R in live trading. The win rate of 52% with average P&L of 68% of maximum profit reflects the butterfly's unusual characteristic: when it wins, it wins significantly – stocks that close near the centre strike generate high percentages of the 4:1 maximum payoff. When it loses, it loses the full debit – but the debit is small enough that the expected value calculation remains positive at optimal filter conditions.
Breakeven win rate clarification: The theoretical breakeven win rate at 4:1 max profit is 20% (risk 1 to make 4). However, because actual winning trades average 68% of max profit in our backtest (not the full 4:1), the required win rate for breakeven is approximately 27% – still the lowest among all earnings strategies, but higher than the theoretical 20%. The butterfly remains attractive for traders comfortable with win rates below 50% who seek high reward-to-risk when the setup is right.
When to Use the Butterfly vs Other Earnings Structures
| Condition | Butterfly | Iron Condor | Straddle |
|---|---|---|---|
| IV rank | 50-65 | Above 50 | Below 30 |
| Move Ratio | Below 0.80 | Below 0.85 | Above 1.0 |
| Historical earnings move | Below 5% typical | Below implied move | Above implied move |
| Directional view | Specific price target available (ATM for most) | No directional view | No directional view |
| Account size | Any – low absolute debit | $15,000+ | Any |
| Profit structure | Defined profit + defined risk | Defined risk, wide profit zone | Unlimited profit potential |
| Maximum reward-to-risk | 4:1 | 0.8-1.2:1 | Unlimited |
| Win rate required for positive EV (realistic) | ~27% (theoretical 20%) | 55%+ | 45%+ |
The butterfly's low required win rate – the lowest of any strategy in the cluster – means it can be profitable even when it loses most of the time, provided the wins approach the high end of the 4:1 payoff. No other earnings structure has this characteristic. It is the correct tool when the specific stock has shown a historical tendency to undershoot the implied move consistently and when a reasonable price target for the post-earnings close is identifiable (typically ATM for neutral expectations).
Quick Reference
Step 1 – IV Rank Check
Optimal: 50-65. Acceptable: 30-50. Outside range: avoid or use iron condor.
Step 2 – Move Ratio
Historical average move (last 8 earnings) ÷ implied move – must be below 0.80
Step 3 – Centre Strike
ATM for most traders. Directionally biased only with clear technical justification and experience.
Step 4 – Strike Width
5 or 10 wide – not $2.50 for earnings events
Step 5 – Verify P&L Structure
Max profit = (width − debit) × 100. Must be at least 3:1 vs net debit.
Profit zone = centre strike ± max profit per share. Must encompass historical average move.
Step 6 – Sizing
3% of account maximum. Net debit × contracts ≤ 3% of account.
Step 7 – Exit
Default: morning after earnings, wait 20-30 minutes
Stock at centre strike: may hold 1-2 additional sessions within 2% of centre
Stock beyond outer strikes: exit immediately, maximum loss accepted
Expiration Friday: exit all legs before 3:30 PM ET
FAQ: The Butterfly Precision
Q: What makes the Butterfly Spread different from an Iron Condor for earnings?
A: While both profit from a stock staying in range, the Butterfly is a defined-debit structure with a much higher reward-to-risk ratio (up to 4:1). Unlike the Iron Condor, which has a wide profit "table," the Butterfly has a precise peak profit at the center strike, making it the most targeted structure for specific price targets.
Q: Why is "Moderate IV" (IV Rank 30-65) the sweet spot for this strategy?
A: If IV is too low, the middle "body" calls don't collect enough premium to offset the wings. If IV is too high, the cost of the outer "wing" calls inflates, compressing your potential profit. Moderate IV provides the most efficient balance of cost and collection.
Q: When should I exit an Earnings Butterfly?
A: The default exit is the morning after earnings. You should wait 20-30 minutes after the market opens to let bid-ask spreads normalize before closing all three legs. If the stock is pinned exactly at your center strike, you may hold for 1-2 additional sessions to capture residual decay, but never beyond 3 days.
BreakoutBulletin | Market Education Series
Educational commentary only. Not investment advice. Past performance does not guarantee future results. Performance data based on S&P 500 large-cap $5-wide long call butterfly review, ATM centre strike, front-month expiration, entered 1-2 days before earnings, exited morning after earnings, January 2019-December 2025, n=612 qualifying setups. Transaction costs reduce expected value by approximately 15-20%. S&P 500 large-cap only – survivorship bias applies. Live results will differ.