
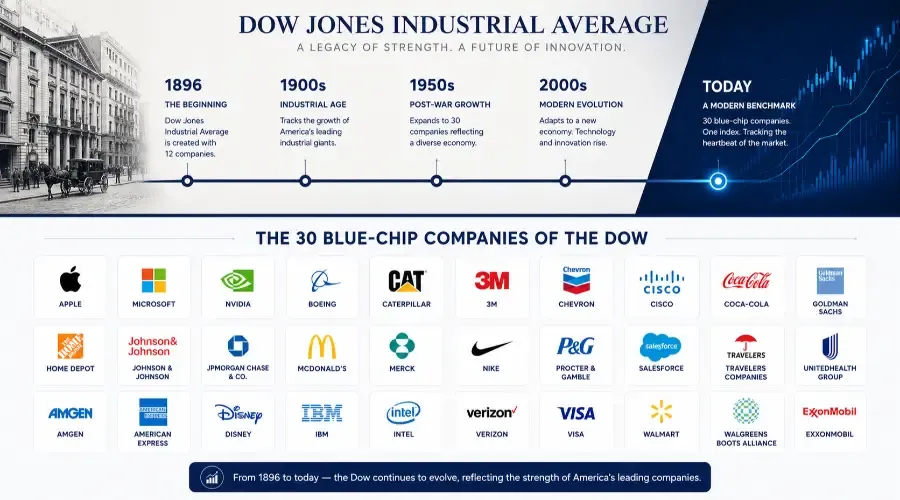
The Dow Jones Industrial Average is the most-cited stock market index in mainstream media. When a news anchor says "the market closed up 300 points," they almost always mean the Dow. Understanding what it actually measures – and where it falls short – helps you read that coverage more accurately.
What the Dow Tracks
The DJIA tracks 30 large U.S. companies selected by editors at S&P Dow Jones Indices. The selection is discretionary, not rules-based. Companies are chosen based on their prominence, broad industry representation, and long record of sustained growth. The current 30 include Apple, Microsoft, Nike, Disney, Goldman Sachs, JPMorgan Chase, Coca-Cola, McDonald's, Walmart, and Boeing, among others.
Notable absences: Alphabet (Google), Meta, Netflix, and Tesla have not historically been Dow components, which means the index underrepresents the technology and growth sectors relative to the broader market.
How the Dow Is Calculated
The Dow uses price weighting – a methodology that sets it apart from most modern indices. In a price-weighted index, a stock's influence on the index's daily move is proportional to its share price, not its market capitalization.
A stock trading at $300 per share moves the Dow three times as much as a stock trading at $100 per share, regardless of which company is larger in terms of total market value. Goldman Sachs, with a relatively high share price, has historically moved the Dow more than some larger companies with lower per-share prices.
This is a structural limitation. Market-cap weighting – used by the S&P 500 – more accurately reflects each company's actual size in the economy. Price weighting can distort the picture.
Points vs. Percentages
Media coverage emphasizes points. "The Dow fell 600 points today" is a common headline. The problem is that points mean different things at different index levels.
At a Dow level of 42,000, a 600-point drop is 1.43%. At a Dow level of 10,000, the same 600-point drop would be 6% – four times the proportional impact. Always convert to percentage to assess significance.
The same logic applies to positive moves. "Dow up 500 points" at 44,000 is less than 1.2%. A genuine cause for attention; not a cause for excitement.
Coverage vs. the S&P 500
The Dow covers roughly 25% of total U.S. stock market capitalization. The S&P 500 covers approximately 80%. For a comprehensive read on broad market direction, the S&P 500 is the more representative benchmark.
That said, the Dow and S&P 500 typically move in the same direction – they share many constituents and reflect the same underlying economic conditions. When they diverge notably, it usually reflects sector-specific dynamics. If the Dow rises while the S&P 500 lags, it often indicates strength in the traditional, non-tech names that the Dow over-represents.
Investing in the Dow
The primary ETF tracking the Dow is DIA (SPDR Dow Jones Industrial Average ETF Trust), with an expense ratio of approximately 0.16%. Buying DIA gives you proportional exposure to all 30 Dow components.
For comparison, VOO (S&P 500 ETF) charges 0.03% and covers 500 companies including the Dow 30 plus 470 additional businesses. Historically, the S&P 500 has outperformed the Dow over 5- and 10-year periods, partly because of its broader tech exposure and partly because market-cap weighting more accurately reflects actual company sizes.
When the Dow Is Useful
The Dow serves two purposes well. First, it provides a quick daily market pulse – when you want a rough sense of whether stocks broadly rose or fell, checking the Dow takes about five seconds. Second, it functions as a historical reference. The DJIA has data going back to 1896, making it the only index with meaningful coverage of U.S. market history across that full span.
For portfolio benchmarking, the S&P 500 is the more accurate reference. For casual market monitoring, the Dow remains a reasonable shorthand.
This content is for educational purposes only and does not constitute investment, legal, or tax advice. Investing in securities involves risk, including possible loss of principal. Always conduct your own research and consult a licensed financial professional before making investment decisions.
The Dow is the most-cited index in mainstream media and the least representative of actual market performance. Understanding why helps you read coverage more accurately.
→ Stock Market Indices Explained → The full comparison of the Dow, S&P 500, and NASDAQ - www.breakoutbulletin.com/article/how-stock-markets-function-exchanges-liquidity
→ What Are Stock Market Indices? → What indices measure and which one to use as your benchmark - www.breakoutbulletin.com/article/stock-market-indices-for-teens
→ The S&P 500 Deep Dive → Why the S&P 500 is a more representative benchmark than the Dow - www.breakoutbulletin.com/article/sp-500-for-teens-guide