
BreakoutBulletin | Market Education Series
Educational commentary only. Not investment advice. Past performance does not guarantee future results.
A Pattern Is Not a Shape. It Is a Story.
Let me tell you something I learned after years of watching people lose money on “perfect” W patterns. Every double bottom on a chart is a record of collective human emotion played out over days, weeks, or months. The W shape that technical analysis textbooks describe as a “reversal pattern” is actually the visible residue of thousands of individual decisions made by traders experiencing fear, relief, hope, doubt, and finally conviction in sequence.
Understanding the emotional journey behind the pattern changes how you trade it entirely. Instead of drawing a W on a chart and waiting for price to clear the neckline, you begin reading why the W is forming - whether the emotional sequence unfolding is genuine and institutional or shallow and retail. That distinction is what separates tradeable double bottoms from the countless W-shaped price structures that fail to produce meaningful reversals.
This guide tells the story first. The mechanics are the translation of that story into entry rules, stops, and targets. Learn the story and the mechanics become obvious. Learn only the mechanics and you will enter technically valid setups that fail because the emotional foundation wasn't there.
Q&A: The Emotional & Mechanical Logic (FAQ Schema)
Q: What makes a double bottom pattern valid?
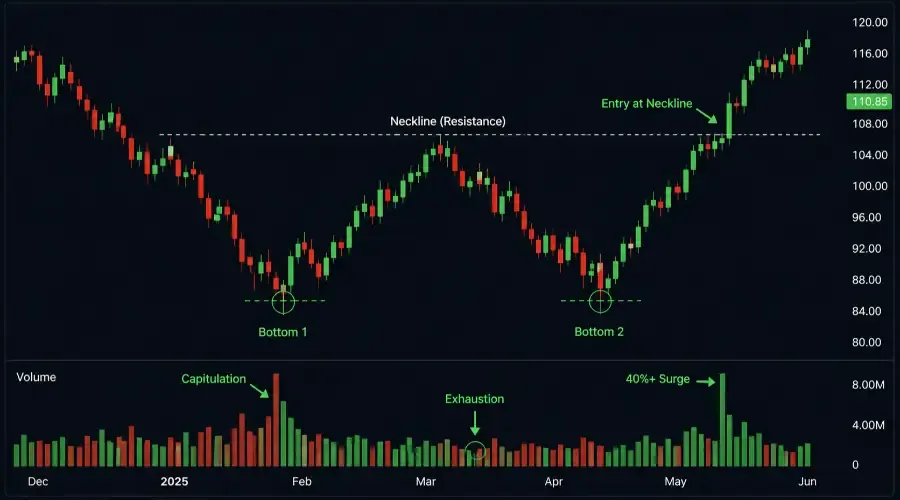
A: A valid double bottom requires two distinct price lows within 3-5% of each other, separated by a middle recovery (the neckline). Crucially, the second bottom must show lower volume than the first, signalling that selling pressure has been exhausted and institutional buyers are defending the level.
Q: Is it safe to buy at the second bottom of a "W" pattern?
A: No. Buying at the second bottom is a predictive bet, not a confirmed trade. The only valid entry is the neckline breakout, where price closes above the recovery high on a volume surge of at least 40% above the 20-period average.
Q: What is the "Measured Move" in a double bottom?
A: The measured move is the primary target for the setup. It is calculated by measuring the vertical distance from the lowest point of the bottoms to the peak of the neckline, then adding that same distance to the breakout price.
Q: Why do many double bottom patterns fail?
A: The most common cause of failure is a low-volume neckline break. Without at least a 40% volume surge, the breakout lacks institutional conviction and is often a “retail trap” that reverses quickly. Additionally, patterns forming in a strong long-term downtrend (below the 200-day SMA) carry higher failure rates.
Act One: The First Bottom - Fear and Capitulation
The story begins with selling.
A stock has been declining. The reasons vary - earnings miss, sector rotation, macro deterioration, institutional distribution. What matters is not the specific cause but the emotional state of the market participants holding the stock: they are afraid.
At a certain price level, something happens. The selling accelerates. The decline that had been gradual becomes sharp. Volume spikes. Intraday moves are large and unpredictable. Every piece of news feels catastrophic. This is capitulation - the point where holders who have been enduring the decline finally give up and sell, and short sellers pile in believing the decline will continue indefinitely.
This capitulation selling produces the first bottom.
But capitulation selling contains the seeds of its own reversal. As price falls rapidly on high volume, a different group of participants begins taking notice: value buyers. These are the institutional investors who have been watching the stock from the sidelines, waiting for the selling to exhaust itself before entering at a price they consider attractive. They don’t buy during the panic - they wait for evidence that the panic is ending.
The evidence they wait for is simple: the selling slows. Volume begins declining from its capitulation peak. The sharp down moves moderate. Price stabilises. The first bottom forms not because the stock is fundamentally “worth” that price in any precise sense, but because the sellers have exhausted themselves and value buyers begin absorbing what remains.
What this means for pattern identification:
The first bottom must show evidence of genuine capitulation - elevated volume during the decline into the low, followed by declining volume as price stabilises. A first bottom that formed on low volume without a volume spike suggests the selling hasn’t fully exhausted itself. The emotional journey hasn’t completed Act One.
The Middle Recovery: Relief and False Hope
After the first bottom, price recovers.
The emotional state of the market shifts from fear to relief. Traders who held through the decline feel vindicated - it looks like the bottom is in. Short sellers who entered near the capitulation low begin covering their positions, adding buying pressure to the recovery. Value buyers who entered at the bottom are now in profit and holding confidently.
The recovery carries price upward - sometimes substantially. The stock may recover 15%, 20%, or more from the first bottom. Sentiment begins improving. Analysts revise their views. The narrative around the stock starts changing.
But the recovery stalls.
At a certain price level - the neckline - overhead resistance appears. Sellers who bought before the decline and have been waiting for a recovery to exit their positions now have the opportunity they were waiting for. They sell into the rally. Momentum buyers who entered the recovery begin taking profits. The buying pressure that drove the recovery from the first bottom exhausts itself.
Price peaks at the neckline and begins declining again.
The emotional state shifts from relief to anxiety. The traders who bought the recovery are now watching their profits evaporate. The traders who held through the first decline are now experiencing the second leg down with significantly less psychological resilience - they’ve already endured one painful decline and now face another.
What this means for pattern identification:
The neckline - the resistance level at the top of the middle recovery - is the most important structural level in the entire pattern. Its validity determines whether the eventual breakout carries genuine significance. A neckline formed on high volume during the recovery, with clear price rejection at the level, is more significant than a neckline formed on low volume with gradual price weakness. The cleaner and more visible the neckline, the more participants are aware of it and the more institutional significance the eventual break carries.
The Institutional Signature: Volume Divergence (Enhanced Structure)
The "Secret Sauce" of the double bottom is not the price, but the Volume Story.
First Bottom: High volume (The Panic).
Second Bottom: Low volume (The Exhaustion).
Neckline Break: Massive volume (The Confirmation).
Act Two: The Second Bottom - The Conviction Test
The second decline is psychologically distinct from the first in one crucial way: every participant who experienced the first bottom is watching this decline with a specific question in mind.
Will it hold?
This question - will the prior low hold or will it break to new lows? Is the central drama of the double bottom pattern. The answer to this question determines everything.
If the prior low breaks, the double bottom fails. The pattern becomes a lower low - confirmation that the downtrend is continuing. Traders who bought the neckline recovery have now watched the stock decline through the prior low. Their stop losses trigger. Sentiment deteriorates further.
If the prior low holds, the narrative changes entirely.
The holding of the prior low - the formation of the second bottom at approximately the same price as the first - is the moment the pattern acquires genuine emotional power. Here is why: the participants who sold during the first bottom’s capitulation have already exited. The sellers are exhausted. But now a second wave of traders approaches the same level with fresh selling intent - and the level holds against them.
This holding against a second wave of sellers is the institutional signal. It means that the buyers who entered at the first bottom - the value buyers and institutional accumulators - are still present and still defending the level. They didn’t distribute their positions during the recovery. They are holding and adding as price returns to their original entry zone.
What the second bottom must show:
The second bottom should form at approximately the same price as the first - within 3-5% - but ideally not at exactly the same price. A second bottom that forms slightly higher than the first is a stronger signal - it means buyers are entering before price even reaches the prior low, demonstrating increasing conviction. A second bottom that undercuts the first low slightly before recovering is acceptable if the undercut is on low volume and price quickly recovers - this is the false break dynamic, a stop hunt that clears remaining sellers before the genuine reversal.
Volume at the second bottom should be lower than volume at the first bottom. This is the critical diagnostic. Lower volume at the second low means that fewer sellers are present on the second test - the supply has been progressively absorbed. Sellers are running out. Higher volume at the second low means new selling pressure is entering - the double bottom thesis is questionable.
The Neckline Break: Confirmation and FOMO
After the second bottom holds, price begins recovering again.
The emotional state of the market is now complex. Traders who experienced both the first and second bottoms and held are now watching hopefully. Traders who missed the first recovery and waited for confirmation are now watching the neckline approach with anticipation. Short sellers who added during the second decline are now underwater and watching nervously.
As price approaches the neckline - the prior recovery high - the tension peaks.
The break of the neckline is the pattern’s confirmation signal. When price clears the neckline with conviction, the short sellers who added during the second decline face capitulation in the opposite direction - they must cover their short positions by buying, adding fuel to the breakout. The traders who were waiting for confirmation now enter - the FOMO buyers. Institutional participants who were building positions at the two bottoms are now fully positioned and watching their thesis confirm.
This combination - short covering, confirmation buyers, and institutional positioning confirming - produces the volume surge that characterises genuine neckline breaks. It is the emotional mirror image of the first bottom’s capitulation selling, but in the opposite direction.
What this means for entry:
The neckline break is the only valid entry point for a double bottom. Not the first bottom. Not the second bottom. Not midway through the second recovery. The neckline.
Identifying the Pattern: Mechanics After the Story
The neckline:
The neckline is the horizontal resistance level connecting the recovery high between the two bottoms. It should be clearly defined - a level where price was visibly rejected during the middle recovery. Draw it as a zone, not a line, using the ATR-based formula from the support level guide: zone width = 0.3-0.5× ATR from the recovery high.
Bottom alignment:
The two bottoms should form at approximately the same price - within 3-5% of each other. Bottoms more than 5% apart weaken the pattern’s emotional narrative.
Duration:
Minimum two weeks between the two bottoms for intraday traders. Minimum four weeks for swing traders. Minimum two months for position traders.
The V-bottom distinction:
A V-shaped recovery from a single low is not a double bottom. It is a different pattern entirely.
The Three Acts of a Double Bottom (Enhanced Structure)
Act One: The First Bottom (Fear) – High-volume capitulation where retail sellers give up and institutional buyers step in.
The Relief Rally (Hope) – A temporary recovery to the neckline that stalls as overhead supply is met.
Act Two: The Second Bottom (Conviction) – A retest of the prior low that proves sellers are gone.
The Neckline Entry: Precision Mechanics
Entry:
The entry triggers on the close of a candle that clears the neckline zone’s upper boundary with volume at least 40% above the 20-period average.
Stop:
Below the second bottom low, plus 0.5× ATR buffer.
Target - the measured move:
Measured from neckline to bottom and projected upward.
Valid vs Invalid Double Bottom: The Side-by-Side Comparison (Validity Diagnostic Table)
| Feature | Valid Double Bottom | Invalid / Weak Pattern |
|---|---|---|
| Bottom Alignment | Within 3-5% of each other | More than 5% apart |
| Duration | 4+ Weeks (Swing) | Compressed (Few days) |
| Second Low Volume | Declining (Exhaustion) | Rising (New selling) |
| Breakout Close | Upper 25% of Daily Range | Long upper wick / Mid-range |
| Neckline Break Vol | 40%+ above average | Average or below |
| Volume at first bottom | Elevated - capitulation spike | Low - insufficient selling exhaustion |
| Volume at second bottom | Lower than first bottom | Equal or higher - new supply entering |
| Neckline definition | Clear horizontal rejection | Ambiguous structure |
| Second bottom formation | Higher than or equal to first | Lower - downtrend continues |
| Prior trend context | Meaningful downtrend | Sideways market |
| Recovery shape | Controlled | V-shaped |
Pre-Entry Checklist
| Condition | Threshold | Check |
|---|---|---|
| Regime score | 2 or 3 — reversal patterns work in both | Yes / No |
| Prior downtrend established | Meaningful decline before pattern — not sideways | Yes / No |
| Two bottoms within 3-5% of each other | Measured from candle closes | Yes / No |
| First bottom showed volume spike | Above 20-period average during capitulation | Yes / No |
| Second bottom volume lower than first | Declining supply confirmed | Yes / No |
| Pattern duration appropriate | Minimum timeframe requirement met | Yes / No |
| Neckline clearly defined | Visible horizontal zone | Yes / No |
| Second bottom not a lower low | Price held at or above first bottom | Yes / No |
| Neckline break candle closes above zone | Not just a wick penetration | Yes / No |
| Neckline break volume | 40%+ above 20-period average | Yes / No |
| Minimum 1.5:1 R:R to measured move | Calculated before entry | Yes / No |
| No binary catalyst within 5 sessions | Earnings calendar checked | Yes / No |
Position Sizing
Formula: Shares = (Account × Risk%) ÷ Stop Distance
| Account | Regime Score | Risk % | Dollar Risk | Stop Distance | Shares |
|---|---|---|---|---|---|
| $10,000 | Score 3 | 1% = $100 | $100 | $9.00 | 11 |
| $10,000 | Score 2 | 0.5% = $50 | $50 | $9.00 | 5 |
| $25,000 | Score 3 | 1% = $250 | $250 | $9.00 | 27 |
| $25,000 | Score 2 | 0.5% = $125 | $125 | $9.00 | 13 |
| $50,000 | Score 3 | 1% = $500 | $500 | $9.00 | 55 |
| $50,000 | Score 2 | 0.5% = $250 | $250 | $9.00 | 27 |
Failure Modes (What I’ve Learned the Hard Way)
The pattern within a downtrend.
Premature entry at the second bottom.
Low-volume neckline break.
Double bottom in a weak sector.
Observed Performance Context
| Condition | Qualifying Setups (n) | Neckline Hold Rate | Measured Move Achievement |
|---|---|---|---|
| Volume confirmed, Score 3 | 187 | 67% | 78% reached target |
| Volume confirmed, Score 2 | 156 | 58% | 69% reached target |
| Low volume break, Score 3 | 112 | 41% | 52% reached target |
| Low volume break, Score 2 | 79 | 28% | 41% reached target |