
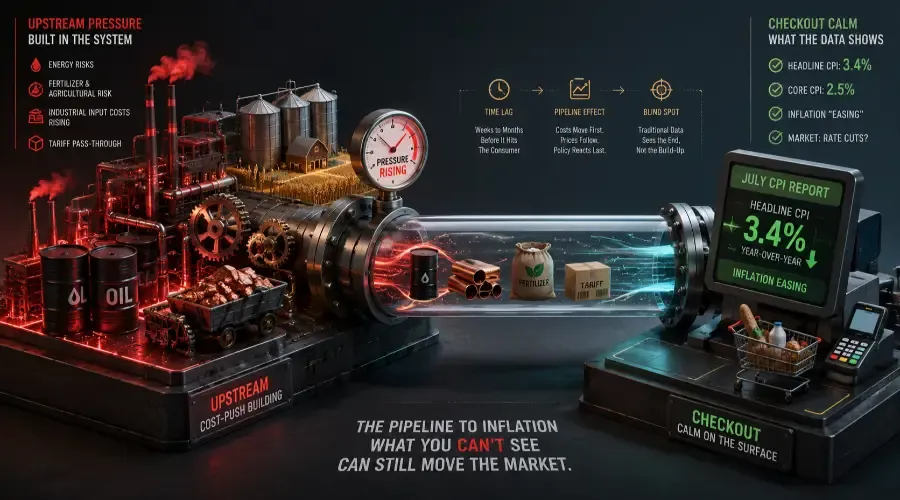
July CPI eased to 3.4% as last quarter's oil spike rolled off. But upstream cost-push is quietly rebuilding where checkout data can't see it and the Fed conversation is turning to hikes.
BREAKOUTBULLETIN · MACRO / SECOND-ORDER SIGNAL
By Manish T. · August 12, 2026 · 6 min read
Three of the biggest financial outlets ran the exact same story this morning: the inflation report is a big deal for the Fed, persistent pressures are in focus, and stock futures are climbing into the print. At 8:30 AM ET, the headline landed - 3.4%, exactly as forecast and everyone asked the same question. Does this let the Fed cut?
That is the wrong question, and the framing hides where inflation is actually heading.
Why the Number Flatters
July headline CPI eased to 3.4% year over year from 3.5%, with core at 2.5%, both landing exactly on consensus. On paper, it reads like disinflation. In reality, it is mostly an energy round-trip.
Headline CPI spiked to 4.2% in May when the conflict in the Middle East pushed crude higher; gasoline then fell early in July on optimism the conflict was ending. This print simply laps a past spike a favorable base effect, not evidence that underlying pressure is easing. Gasoline fell 2.9% on the month and the energy index dropped 1.5% yet energy is still up 14.7% from a year ago, gasoline up 24.6%. Strip that energy round-trip out, and the picture gets stickier: core CPI rose 0.2% on the month after holding flat in June ticking up, not down, with shelter about two-thirds of the monthly increase.
The lesson extends beyond this month's CPI print. Reading economic data releases properly means separating the headline from base effects, revisions, individual components and the forward-looking signals that are still developing underneath the aggregate number. The market can therefore be right about the data and still wrong about what that data means for the next leg of inflation.
The Signal Underneath: The Supply Chain Is Reloading
CPI is a lagging, checkout-end measure. It tells you what already cleared the register, not what is loading upstream and upstream, the cost-push is rebuilding rapidly:
- Energy Resurgence: Gasoline turned higher again late in July as regional fighting resumed.
- Agricultural Risk: Roughly a third of the world's fertilizer capacity sits in the Persian Gulf, queuing up a distinct food-price leg for late 2026. Food inflation can also emerge through the physical supply chain rather than the supermarket shelf. When agricultural supply is abundant but export economics become uncompetitive, grain prices can weaken even while fertilizer, energy and other upstream inputs remain under pressure, creating a very different inflation signal across producers and consumers.
- Goods & Tariffs: Tariff pass-through is still quietly working its way through finished goods.
- Industrial Inputs: Commodity-level pressures are feeding producer costs before reaching the consumer index copper and zinc treatment charges (TCs) have gone negative, grid transformer costs are rising, and diesel faces structural tightness from permanent refinery closures.
This is where commodity market plumbing becomes more informative than the consumer-price headline. Treatment charges, processing capacity, inventories and physical supply constraints can move months before their impact appears in the CPI, making upstream commodity data an important early-warning system for the next inflation leg.
Businesses facing higher energy and input bills inevitably raise prices to cover them. The market is treating a rear-view number as an all-clear, while the windshield shows the next inflation leg forming.
Rear-View Mirror vs. Windshield
| Metric / Driver | Rear-View Mirror (What CPI Sees) | Windshield (What Upstream Shows) |
|---|---|---|
| Energy Impact | Lapping May's crude spike (Gasoline drop) | Persian Gulf transit risks; Diesel structural tightness |
| Metals & Inputs | Deflated goods prices at checkout | Negative copper/zinc TCs; Grid equipment cost-push |
| Agriculture | Stable grocery store shelf prices | 30% of global fertilizer capacity queued in Gulf conflict |
| Fed Reaction | "Disinflation allows rate cuts" | Sticky core MoM forces a hawkish pause or rate hikes |
The Expectations Gap Nobody's Pricing
Three critical realities are ignored by the "Will the Fed cut?" narrative:
- Real Wages Are Shrinking: Inflation at 3.4% is outpacing average hourly earnings growth of 3.2%. Prices are beating pay, quietly eroding consumer purchasing power.
- Labor Is Cracking: July payrolls contracted by around 23,000 against expectations of a 100,000 gain. Weakening job growth alongside sticky prices is the textbook shape of stagflation, not a soft landing.
- Fed Cuts Are Off the Table: Markets continue pricing rate cuts into late 2026. If core inflation stays sticky while labor cracks, the Fed faces a hawkish hold or an outright rate-hike risk—leaving short-end yields priced for a reality that doesn't exist.
The Upstream Positioning Playbook
- Overweight Upstream Cost-Passors: Focus on energy producers, fertilizer equities, and physical industrial metals where supply scarcity forces price acceptance.
- Underweight Long-Duration Multiple Tech: High P/E growth stocks remain hyper-vulnerable if Treasury yields re-price higher on sticky core inflation.
- Hedge the Stagflationary Clash: Utilize TIPS (Treasury Inflation-Protected Securities) or floating-rate instruments as real wages shrink and rate-cut expectations dissolve.
The market didn't solve its inflation problem; it just lapped a base effect. While checkout-end CPI reports look comfortable today, the upstream cost pipeline guarantees that the disinflation narrative is a temporary illusion. Investors trading the rear-view mirror risk getting blindsided by what's coming through the windshield.
BreakoutBulletin publishes analytical research and education for informed investors. Nothing here is a buy or sell recommendation or personalized investment advice; the author is not a registered investment adviser. Figures are the latest available at publication and may be revised. Do your own research.