
US Market Structure | BreakoutBulletin
Every few months a screenshot goes viral across social media: a member of Congress buys a stock, the stock rallies, and retail channels conclude the market is rigged in their favor. The takeaway spreads fast–just copy the lawmakers, they know something you don't. An entire ecosystem now sells that premise back to retail investors: tracker dashboards, alert services, and exchange-traded funds built specifically to mirror congressional transactions.
While it makes for a compelling narrative, the empirical data tells a completely different story. Here is what the evidence actually shows–and how active traders can repurpose these disclosures into a practical policy-risk map.
Key Takeaways
Survivorship Bias Drives the Hype: Headline returns from top-performing lawmakers obscure the vast majority of congressional portfolios that perform in line with or below standard benchmarks.
No Statistically Significant Alpha: Peer-reviewed data on congressional tracking ETFs shows no risk-adjusted outperformance relative to broad indexes.
Factor Exposure over Insider Knowledge: High headline returns in Democrat-tracking funds are largely attributable to an unhedged mega-cap tech factor tilt rather than insider timing.
The 45-Day Mechanical Lag: The STOCK Act permits up to 45 days between execution and disclosure, rendering these filings historical reporting rather than real-time entry signals.
The True Value–Policy Risk Mapping: Disclosures reveal where legislative attention intersects with specific market sectors, helping traders manage headline volatility across existing holdings.
Copy-Trade Myth vs. Institutional Market Reality
| Retail Copy-Trade Myth | Quantitative Market Reality |
|---|---|
| Signal: Lawmakers possess insider stock-picking savant abilities. | Reality: Headline gains stem from factor bets (e.g., mega-cap tech tilt) and survivorship bias. |
| Timing: Copying disclosures allows retail traders to front-run policy moves. | Reality: The STOCK Act's 45-day reporting lag means catalysts have usually already passed. |
| Execution: Buy whatever tickers lawmakers report purchasing. | Reality: Disclosures function as a policy-risk map to size positions against legislative fights. |
The Myth: Lawmakers as Secret Stock-Picking Savants
The copy-trading narrative relies heavily on notable winners. Rep. Terri Sewell posted a ~68% return in 2025, largely driven by a well-timed Nvidia allocation. Rep. Donald Norcross delivered ~71% in the same period holding essentially two names, while Rep. Warren Davidson recorded a standout year riding GE and GE Vernova. These figures are verified, drawn directly from STOCK Act filings and aggregated by platforms like Quiver Quantitative, Capitol Trades, and Unusual Whales.
The flaw in building a strategy around these headline numbers is classic survivorship bias. Focusing strictly on top performers ignores the dozens of members whose portfolios generated mundane returns, as well as members like Rep. Daniel Meuser, who disclosed selling Nvidia nearly every year since 2022 and missed a major sector expansion.
What the Data Actually Says
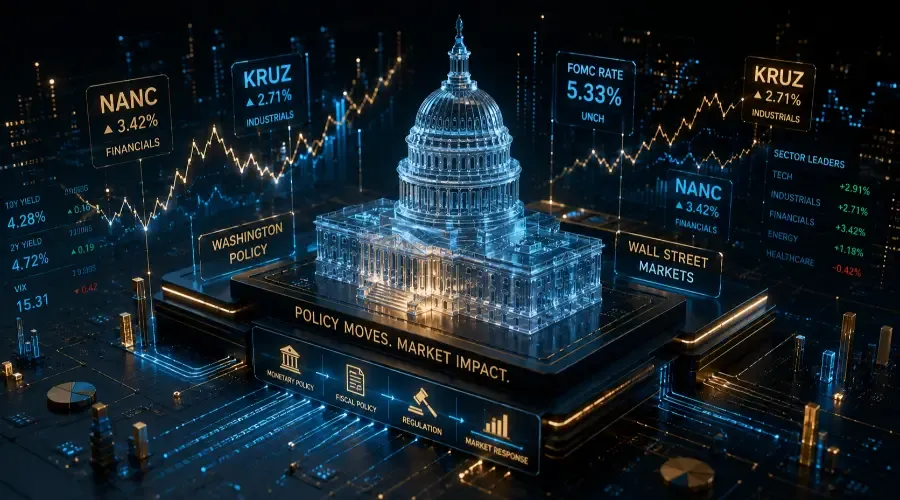
The most objective test of congressional stock-picking is the performance of funds designed to mirror their trades: NANC (which tracks Democratic members) and KRUZ (which tracks Republican members).
The 45-Day Execution Gap: The STOCK Act grants lawmakers up to 45 days to report a transaction. By the time a trade becomes public record, the price has typically adjusted to the catalyst. You are not front-running news; you are reading trade history.
[Congressional Trade Executed] ──► Up to 45-Day Lag ──► Public STOCK Act Disclosure ──► Retail Entry (Late)Furthermore, performance in NANC was driven primarily by factor weighting rather than policy foreknowledge. The fund maintains heavy exposure to mega-cap technology names like Nvidia, Microsoft, and Amazon. When tech pulled back in 2025, NANC declined approximately 10.5% over three months, while the value- and energy-heavy KRUZ ETF remained essentially flat. The variance in performance underscores sector factor exposure, not systemic insider timing.
What Disclosures Are Good For: A Policy-Risk Map
While congressional filings fail as real-time buy signals, they serve a clear purpose as a policy-risk map.
56% Overlap: In a 16-month sample, 6,170 out of 11,016 congressional purchases were in sectors directly overseen by the lawmaker’s own committees. That’s a policy-risk density map, not a tip sheet.
Rather than interpreting this overlap as a tip sheet, institutional traders treat it as a measure of density between market valuation and legislative action:
- Semiconductor & AI Hardware: Directly impacted by export controls and national security appropriations fights.
- Defense Prime Contractors: Highly sensitive to annual defense authorization calendars.
- Biotech & Pharma: Subject to FDA approval cycles and Medicare pricing negotiations.
For an active trader, this data answers a critical position-sizing question: "Does this holding sit in a sector facing imminent legislative headline risk, and is my portfolio sized to handle that potential volatility?"
Real-world example: If a senior defense appropriator discloses a purchase in a niche defense contractor, the useful trade isn't copying the buy; it’s checking whether your existing defense holdings face upcoming contract votes or budget markups that could swing the stock.
The Legislative Horizon: Watching the Stop Insider Trading Act
The landscape surrounding congressional trading may undergo structural changes due to pending legislation.
As of 2026, the Stop Insider Trading Act–introduced in the Senate by Sen. Pete Ricketts with Sen. Deb Fischer cosponsoring, alongside a House companion led by Rep. Bryan Steil–proposes to ban members of Congress, their spouses, and dependent children from purchasing individual stocks. The proposed framework would restrict investments to compliant avenues like broad-based index funds and qualified blind trusts.
If passed, a statutory ban would trigger forced unwinds in heavily tracked stocks and reduce the capital flows supporting copy-trading ETFs. Tracking the legislative progress of reform bills provides a clearer macro signal than monitoring individual transaction reports.
The Bottom Line
Congressional trade disclosures do not offer an automated edge for beating the market, and the ETFs designed around them confirm that risk-adjusted alpha is negligible. The 45-day reporting window prevents retail traders from executing ahead of market moves.
However, when viewed as a risk-management tool, these filings highlight where regulatory attention is concentrated. Active traders who use disclosure data to map headline risk across their sector watchlists gain a practical framework for position sizing and portfolio protection.
FAQ
Can you beat the market by copying congressional trades?
No. Peer-reviewed studies of congressional tracking funds (NANC and KRUZ) show no statistically significant risk-adjusted outperformance compared to broad market benchmarks.
Why doesn't copy-trading Congress work in practice?
The primary obstacle is the STOCK Act's 45-day disclosure window. By the time a trade is publicly reported, the market has already priced in the move. Additionally, high headline returns are often driven by general tech sector factor exposure rather than proprietary timing.
What is the Stop Insider Trading Act?
It is 2026 legislation proposed by Sen. Pete Ricketts, Sen. Deb Fischer, and Rep. Bryan Steil aimed at banning lawmakers, their spouses, and dependent children from trading individual stocks, directing them toward diversified funds or blind trusts.
How should traders actually use STOCK Act filings?
Traders should use disclosures to map policy risk. High concentrations of trades in specific sectors (e.g., defense, healthcare, semiconductors) highlight where upcoming legislative debates or committee hearings could introduce stock volatility.
Educational Research Disclaimer: This article is strictly for educational and research purposes and does not constitute financial or investment advice. Data figures are derived from STOCK Act Periodic Transaction Reports filed with the House Clerk and Senate Electronic Financial Disclosure system, aggregated via Quiver Quantitative, Capitol Trades, and etf.com. Verify all transaction details against primary government filings before making investment decisions.