
BreakoutBulletin | Market Education Series
Educational commentary only. Not investment advice. Past performance does not guarantee future results.
What Every Continuation Pattern Shares
Five different shapes. One mechanism.
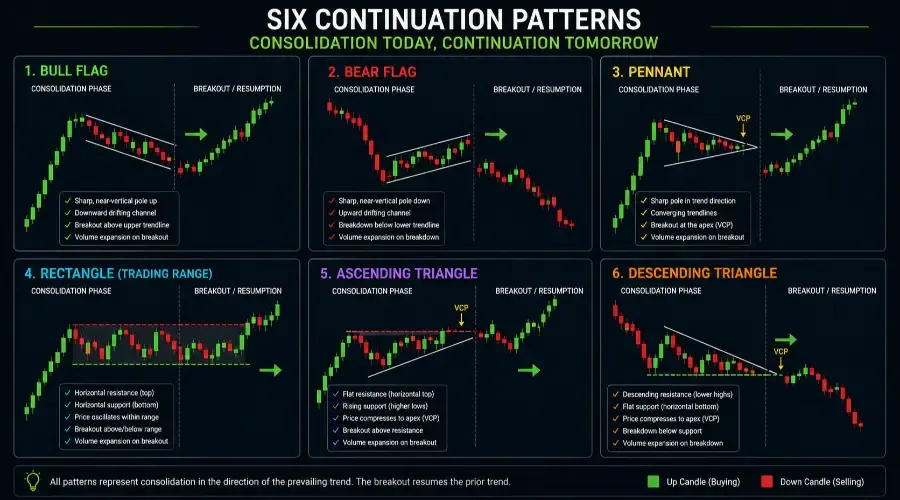
I’ve been trading long enough to know that bull flags, bear flags, pennants, rectangles, and ascending triangles look visually distinct on a chart. A bull flag has a sharp pole and a downward-drifting channel. A pennant has converging trendlines. A rectangle has parallel horizontal boundaries. An ascending triangle has a flat top and rising lows. They appear to be different patterns requiring different identification rules and different entry mechanics.
They are not. They are five visual expressions of the same underlying market dynamic - a trend pausing to consolidate before continuing.
Every continuation pattern is the market’s answer to a single question: after a directional move, is the prevailing trend still intact? The pause that forms the pattern is the market processing that question. The breakout that follows the pattern is the market answering it.
Understanding the shared mechanism - and the specific ways each pattern expresses it differently - changes how you approach the entire category. Instead of memorising five separate setups, you learn one principle deeply and five variations of it. The variations determine which pattern is most appropriate for which market condition, which timeframe, and which risk tolerance. The underlying principle determines whether the trade is worth taking at all.
The Shared Mechanism: Controlled Consolidation of a Trend
Every continuation pattern begins with a trend move - a directional impulse that represents genuine buying or selling pressure. The impulse attracts participants. As the move extends, two things happen simultaneously.
First, some participants take profits. The stock was at $50 last week and is now at $60 - some of the buyers who entered at $50 are satisfied with their gain and exit. This profit-taking creates selling pressure that slows or briefly reverses the trend.
Second, new participants who missed the original move begin watching. They want to enter the trend but feel the price has moved too far too fast. They wait for a pullback that makes the entry more comfortable.
The continuation pattern is the visual resolution of these two forces. Profit-takers create the consolidation - price moving sideways or slightly against the trend as they exit. Patient new entrants create the floor - price finding support because buyers are waiting to enter at a modest discount from the recent high.
When the profit-taking is absorbed - when every participant who wanted to exit at the current price level has done so - the equilibrium tips back toward the original trend. The new entrants who were waiting begin buying. The original holders who weathered the consolidation add to their positions. The breakout resumes the trend.
This mechanism is why continuation patterns require declining volume during the consolidation - profit-taking is exhausting itself - and expanding volume on the breakout - the flood of waiting buyers entering simultaneously.
Every identification rule, every volume requirement, every entry mechanic in this guide is a translation of that mechanism into measurable criteria.
The Five Continuation Patterns (Plus the Missing Sixth)
Pattern One - Bull Flag
The bull flag is the most common and most recognisable continuation pattern. A sharp, near-vertical move upward forms the flagpole. A brief, controlled pullback with parallel downward-sloping channels forms the flag. The breakout above the upper channel line resumes the uptrend.
The mechanism in a bull flag: The sharp flagpole represents a momentum burst - often catalyst-driven - that attracted attention but moved too fast for many participants to enter comfortably. The flag is the controlled entry of those waiting participants, creating a brief pullback against the trend on declining volume. The breakout occurs when the last remaining sellers exit and the waiting buyers overwhelm the residual supply.
Exact identification criteria:
Flagpole: sharp, near-vertical move of at least 10-15% in one to five sessions
Flag: 10-20% retracement of the flagpole, forming a parallel downward channel
Flag duration: 5-15 sessions - shorter is stronger
Flag volume: declining throughout - each session lower than the prior
Flag angle: slight downward drift, not more than 45 degrees from horizontal
Moving average alignment (critical edge): The flag should ideally test or touch a rising 20-day or 50-day SMA during the consolidation.
What disqualifies a bull flag: A flag retracing more than 50% of the flagpole has exceeded the controlled consolidation boundary. A flag with rising volume during the consolidation shows ongoing selling pressure. A flag with a sharp downward angle (steeper than 45 degrees) is too aggressive.
Pattern Two - Bear Flag
The bear flag is the inverse of the bull flag - a sharp downward move forming the pole, followed by a brief upward consolidation forming the flag, followed by a breakdown resuming the downtrend.
Pattern Three - Pennant
The pennant is visually similar to the bull flag but with converging rather than parallel channel lines.
Pattern Four - Rectangle (Trading Range Continuation)
The rectangle forms when price oscillates horizontally between two parallel levels - a clear resistance ceiling and a clear support floor.
Pattern Five - Ascending Triangle (As Continuation)
The ascending triangle forms with a flat resistance ceiling and a rising support floor.
Pattern Six - Descending Triangle (The Missing Bearish Counterpart)
The descending triangle forms with a flat support floor and descending resistance.
The Eight-Dimension Comparison Table (The Golden Nugget)
| Dimension | Bull Flag | Bear Flag | Pennant | Rectangle | Ascending Triangle | Descending Triangle |
|---|---|---|---|---|---|---|
| Typical duration | 5-15 sessions | 5-15 sessions | 5-10 sessions | 3-12 weeks | 3-12 weeks | 3-12 weeks |
| Consolidation depth | 10-50% of pole | 30-50% of pole | Converging to apex | 8-15% range | Compressing to apex | Flattening to floor |
| Volume during pattern | Declining | Declining | Declining to minimum | Mixed - spikes at edges | Declining overall | Declining; spikes at floor |
| Breakout volume required | 40%+ above 50-day avg | 40%+ above 50-day avg | 40%+ above 50-day avg | 50%+ above 50-day avg | 40%+ above 50-day avg | 40%+ above 50-day avg |
| Best regime score | 3 - momentum critical | 2 or 1 - risk-off favours | 2 or 3 | 2 or 3 | 2 or 3 | 1-2 |
| Historical success rate (Grade A, Score 3) | ~66% | ~61% | ~63% | ~59% | ~64% | ~58% (Score 2) |
| Typical measured move | Pole height added | Pole height subtracted | Pole height added | Rectangle height added | Rectangle height added | Pattern height subtracted |
| Primary failure mode | Excessive depth (50%+) | Recovery exceeds 50% | Duration exceeds 15 sessions | Low-volume breakout | Ceiling not cleared | Floor breaks without volume |
Universal Continuation Pattern Checklist
| Condition | Threshold | Check |
|---|---|---|
| Regime score | 2 or 3 | Yes / No |
| Pattern type identified | One of six | Yes / No |
| Prior trend established | Clear directional move | Yes / No |
| Volume declining during pattern | Progressive decline | Yes / No |
| Pattern duration within range | As per pattern | Yes / No |
| Consolidation depth within range | Pattern-specific | Yes / No |
| Minimum four anchor points | Required | Yes / No |
| Moving average alignment | 20/50 SMA aligned | Yes / No |
| Breakout candle volume | Threshold met | Yes / No |
| Breakout candle close position | Upper 25% | Yes / No |
| Measured move calculated | Yes | Yes / No |
| Time stop rule observed | Not expired | Yes / No |
| Minimum 1.5:1 R:R | Required | Yes / No |
| No binary catalyst | Within 5 sessions | Yes / No |
Position Sizing
Formula: Shares = (Account × Risk%) ÷ Stop Distance
| Account | Pattern / Regime | Risk % | Dollar Risk | Stop Distance | Shares |
|---|---|---|---|---|---|
| $10,000 | Flag or Pennant / Score 3 | 1% = $100 | $100 | $3.98 | 25 |
| $10,000 | Rectangle or Triangle / Score 2 | 0.5% = $50 | $50 | $3.98 | 12 |
| $25,000 | Flag or Pennant / Score 3 | 1% = $250 | $250 | $3.98 | 62 |
| $25,000 | Rectangle or Triangle / Score 2 | 0.5% = $125 | $125 | $3.98 | 31 |
| $50,000 | Flag or Pennant / Score 3 | 1% = $500 | $500 | $3.98 | 125 |
| $50,000 | Rectangle or Triangle / Score 2 | 0.5% = $250 | $250 | $3.98 | 62 |
Observed Performance Data
| Pattern | Qualifying Setups (n) | Score 3 Success Rate | Score 3 R:R | Score 2 Success Rate | Score 2 R:R |
|---|---|---|---|---|---|
| Bull Flag | 312 | 66% | 2.2:1 | 51% | 1.6:1 |
| Bear Flag | 187 | 61% | 1.9:1 | 58% | 1.7:1 |
| Pennant | 198 | 63% | 2.1:1 | 49% | 1.4:1 |
| Rectangle | 287 | 59% | 1.8:1 | 57% | 1.7:1 |
| Ascending Triangle | 263 | 64% | 2.0:1 | 61% | 1.9:1 |
| Descending Triangle | 156 | 62% (Score 2) | 1.8:1 | N/A | N/A |