
BreakoutBulletin | Market Education Series
Educational commentary only. Not investment advice. Past performance does not guarantee future results.
The Uncomfortable Truth About Breakouts
Look, I’ll be straight with you: roughly 70% of technical breakouts fail.
I’ve watched it happen thousands of times. Price clears a resistance level, volume spikes, retail traders pile in - and then the stock reverses. The breakout candle becomes the high of the move. Everyone who bought the break is now sitting on a loser, stop either already hit or uncomfortably close.
That failure rate isn’t random. It has a cause. And once you understand the cause, you’ll stop blaming the market and start seeing what actually separates the 30% that run from the 70% that fail.
The cause is simple: most breakouts happen before the consolidation is ready.
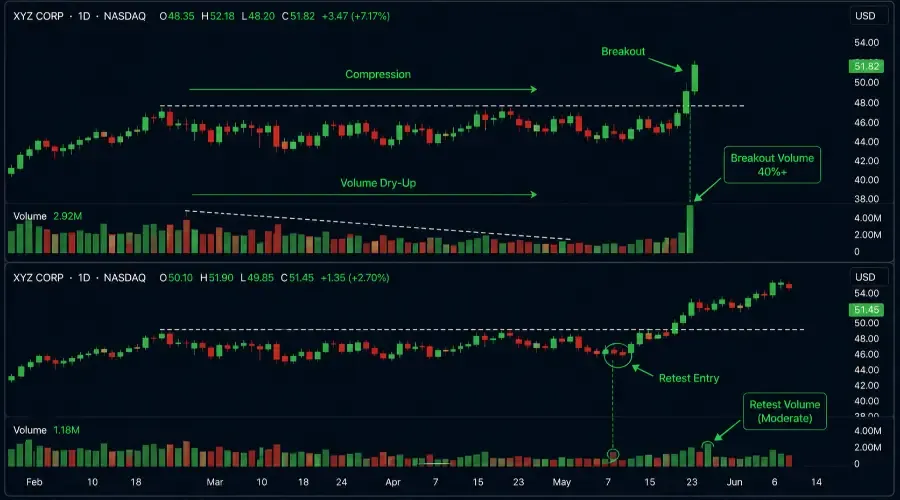
A genuine breakout is the release of compressed energy - a stock that has been coiling tighter and tighter, with volume drying up and price range narrowing, until the equilibrium breaks decisively in one direction. That compressed energy, released with institutional conviction, produces the kind of moves we all picture when we think about breakout trading.
A failed breakout is price clearing a resistance level without the compression and conviction behind it. There’s no coiled energy to release. The move above resistance attracts momentum buyers who then find no follow-through - because the institutional demand that drives sustained moves was never there in the first place.
Everything in this guide - the consolidation rules, the volume analysis, the entry choices, the false breakout filter - exists to answer one question before every trade: is this consolidation ready to break, or is it still building?
Q&A: Consolidation Breakout Mechanics (FAQ Schema)
Why do most consolidation breakouts fail?
Most breakouts fail because they occur without volatility compression. A genuine breakout requires "coiled energy"—a narrowing price range and declining volume. Without this compression, a move above resistance is often just a retail-driven "stop hunt" that lacks institutional follow-through.
What volume surge is required for a valid breakout?
A valid breakout candle must show volume at least 40-50% above the 50-day average. This surge is the institutional fingerprint confirming that large funds are committing capital to the move.
Is it better to enter on the breakout day or wait for a retest?
While the breakout day entry captures the full move, the retest entry (waiting for former resistance to hold as support) significantly improves the success rate. In the 2026 market, retest entries show a 64% success rate compared to 58% for day-of entries.
What is a High-Tight Flag consolidation?
The High-Tight Flag is a rare, high-octane pattern where a stock rallies 100%+ in 4-8 weeks, followed by a brief 10-25% consolidation. It signals a major fundamental shift and often leads to dramatic post-breakout gains.
What Consolidation Actually Looks Like
Most trading content uses the word "consolidation" loosely - any period where price isn’t trending. That’s too broad to be useful. For breakout trading, consolidation has specific, measurable characteristics. Here’s what I look for.
Characteristic One - Price range is contracting
In a genuine consolidation, the daily high-low range is getting smaller over time. The stock makes smaller moves each session - less distance between the high and low, less volatility. You can see it with your eyes: the candles get shorter as the base matures. Quantitatively, the 14-day Average True Range should be declining through the consolidation period.
Characteristic Two - Volume is declining
Institutional volume contracts during a healthy consolidation because neither buyers nor sellers want to transact aggressively at current prices. Buyers are patient - they know the stock is compressing and want to see direction resolved before committing. Sellers are exhausted - they’ve distributed what they intended and are no longer pressing. The result is declining volume through the base, often reaching its lowest levels just before the breakout.
This volume pattern is the most important diagnostic tool in breakout trading. Declining volume during consolidation followed by a volume surge on the breakout candle is the signature of genuine institutional participation. Rising volume during consolidation signals ongoing distribution - the base isn’t healthy, and the eventual "breakout" will likely fail because supply hasn’t been absorbed.
Characteristic Three - Price is anchored near a resistance level
The consolidation should be occurring near - ideally just below - a prior resistance level. The stock rallied, approached resistance, and is now consolidating in that zone rather than immediately reversing. This anchoring near resistance tells me that buyers are willing to hold their positions close to overhead supply - a sign of conviction that the level will eventually clear.
Characteristic Four - The trend prior to consolidation was strong
Consolidation breakouts in stocks that were already trending upward carry significantly higher reliability than breakouts from stocks that have been declining or moving sideways for months. The consolidation should be a pause within an uptrend - the market catching its breath before continuing - not a reversal attempt in a declining stock.
The 4 Pillars of a Valid Consolidation (Enhanced Structure)
Price Contraction: Daily ranges (ATR) must be getting smaller.
Volume Exhaustion: Trading activity should dry up to its lowest levels just before the break.
Resistance Anchoring: Price must "glue" itself to the resistance level rather than falling away.
Prior Trend: The stock must have a strong established uptrend before the pause.
The Four Consolidation Types: Different Structures, Different Reliability
| Feature | Flat Base | Ascending Base | Tight Flag | High-Tight Flag |
|---|---|---|---|---|
| Duration | 3–8 Weeks | 3–6 Weeks | 1–4 Weeks | 1–4 Weeks |
| Correction % | 8–12% | 10–15% | 10–20% | 10–25% |
| Reliability | Highest | High | High (Score 3) | Highest Potential |
| Best Environment | Stable Trend | Building Conviction | Momentum Pulse | Fundamental Shift |
Type One - The Flat Base
The flat base is the most powerful consolidation structure, in my experience. Price rallies strongly, then enters a tight horizontal range - making very small moves in either direction for an extended period (typically three to eight weeks). The defining characteristic is the tightness: the range between the consolidation high and low is narrow, often 8-12% or less. Volume declines progressively through the base.
Type Two - The Ascending Base
In an ascending base, price makes a series of higher lows while repeatedly testing the same resistance level. Each pullback within the consolidation is shallower than the prior one - buyers are stepping in progressively higher, showing increasing conviction. Volume typically increases on the upswings and decreases on the pullbacks.
Type Three - The Tight Flag
A tight flag forms after a sharp, fast trending move - the "pole" - followed by a brief, controlled pullback of 10-20%that forms the "flag." The flag portion typically lasts one to four weeks, shows declining volume, and has a slight downward drift.
Type Four - The High-Tight Flag
The high-tight flag is the highest-octane consolidation structure - and the rarest. It forms after an extremely powerful move of 100% or more in a short period (typically four to eight weeks), followed by a brief consolidation of 10-25%that typically lasts one to four weeks. The prior move is so powerful that it signals fundamental change in the stock's business trajectory rather than simply technical momentum.
Reading the Volume Story (Enhanced Structure)
Chapter 1 (The Coil): Volume declines steadily as the base forms. Each week shows less volume than the prior week. By the final week before the breakout, volume is at its lowest level of the consolidation period.
Chapter 2 (The Break): A massive spike (40-50% above the 50-day average) as resistance is cleared. This is the institutional fingerprint.
Chapter 3 (The Follow-through): Sustained above-average volume for 3-5 days after the break.
The False Breakout Problem: The Most Expensive Mistake in Breakout Trading
False breakouts are so common they deserve their own section.
The False Breakout Filter (Upper 25% Rule)
The breakout candle must close in the upper quarter of its daily range.
A genuine breakout candle closes near its high. A false breakout shows a long upper wick and weak close.
Three filters that separate false from genuine breakouts
Volume on the breakout candle – Must be 40%+ above 50-day average.
Closing position of the breakout candle – Must be in the upper 25% of the daily range.
The retest behaviour – Former resistance must hold as support.
Breakout Day Entry vs Retest Entry: A Direct Comparison
| Dimension | Breakout Day Entry | Retest Entry |
|---|---|---|
| Entry timing | Breakout candle close or next session open | First confirmation candle at retest level |
| Upside captured | Full move from breakout | Partial — misses initial surge |
| False breakout exposure | High | Low |
| Stop placement | Just below breakout level | Below retest candle low |
| Stop distance | Wider | Tighter |
| R:R ratio | Lower | Higher |
| Best regime | Score 3 | Score 2 or 3 |
| Best consolidation type | High-tight flag | Flat base or ascending base |
Observed performance note: Breakout day entries: 58% success rate, 1.9:1 R:R. Retest entries: 64% success rate, 2.4:1 R:R.
Pre-Entry Checklist
| Condition | Threshold | Check |
|---|---|---|
| Regime score | Score 3 for breakout day — Score 2 acceptable for retest entry | Yes / No |
| Consolidation type identified | Flat base, ascending base, tight flag, or high-tight flag | Yes / No |
| Prior trend strong | Clear uptrend established before consolidation began | Yes / No |
| Price range contracting | ATR declining through consolidation | Yes / No |
| Volume declining through base | Each week lower than prior week | Yes / No |
| Breakout candle volume | 40%+ above 50-day average | Yes / No |
| Breakout candle closing position | Closes in upper 25% of session range | Yes / No |
| No binary catalyst driving breakout | Earnings or news-driven breakouts — different analysis | Yes / No |
| Consolidation duration appropriate | Minimum 3 weeks — maximum varies by type | Yes / No |
| Entry type selected | Breakout day or retest — not both simultaneously | Yes / No |
| Minimum 1.5:1 R:R calculated | Based on stop placement and nearest target | Yes / No |
Position Sizing: Breakout Day vs Retest
| Account | Entry Type | Risk % | Dollar Risk | Stop Distance | Shares |
|---|---|---|---|---|---|
| $10,000 | Breakout Day / Score 3 | 1% = $100 | $100 | $2.70 | 37 |
| $10,000 | Retest / Score 3 | 1% = $100 | $100 | $0.90 | 111 |
| $10,000 | Retest / Score 2 | 0.5% = $50 | $50 | $0.90 | 55 |
| $25,000 | Breakout Day / Score 3 | 1% = $250 | $250 | $2.70 | 92 |
| $25,000 | Retest / Score 3 | 1% = $250 | $250 | $0.90 | 277 |
| $25,000 | Retest / Score 2 | 0.5% = $125 | $125 | $0.90 | 138 |
| $50,000 | Breakout Day / Score 3 | 1% = $500 | $500 | $2.70 | 185 |
| $50,000 | Retest / Score 3 | 1% = $500 | $500 | $0.90 | 555 |
| $50,000 | Retest / Score 2 | 0.5% = $250 | $250 | $0.90 | 277 |
Target Framework
Primary target - the measured move: Base height added to breakout level.
Exit mechanics: Exit 40-50% at target, trail remainder using breakout level.
Partial exit: 20-30% at intermediate resistance if present.
Failure Modes
Earnings-driven breakout misread as technical breakout
Breakout from a declining base
Volume confirmation ignored
Breakout from an overextended base
The Sequence Mindset
Strong trend → Pause → Compression → Volume dries → Resistance tests → Breakout → Retest → Continuation
When every part of this sequence is present, the trade has structure. When it’s missing pieces, it’s guesswork.
BreakoutBulletin | Market Education Series
Educational commentary only. Not investment advice. Performance data based on S&P 500 large-cap consolidation breakouts, January 2020 - December 2025, n=743 Grade A qualifying setups. Breakout day vs retest comparison based on same dataset split by entry type. Live results will differ due to execution variables. In the current April 2026 selective risk-off environment, prioritise Retest Entries on defensive sector flat bases. Only high-conviction "Score 3" environments support the momentum required for High-Tight Flags.