
BreakoutBulletin | Trading Education
Educational commentary only. Not investment advice. Past performance does not guarantee future results.
What Makes a Setup "Classic"
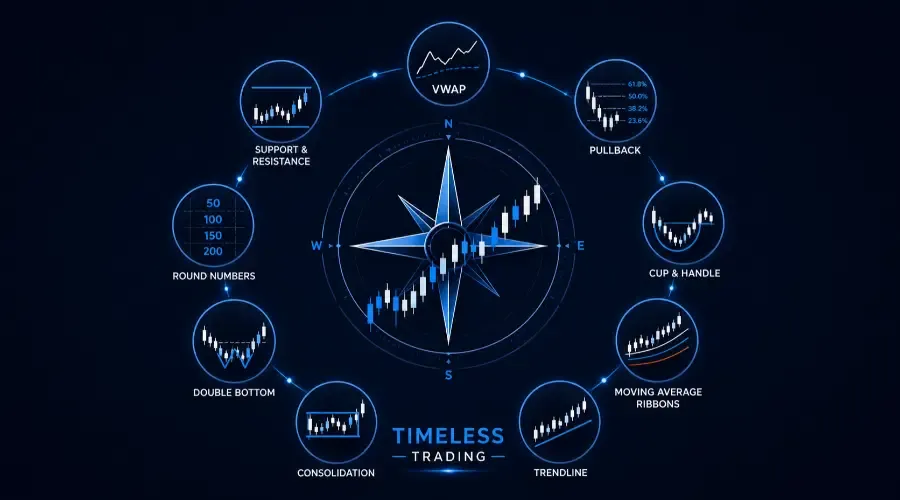
The nine setups in this cluster share one defining characteristic: they have been traded profitably by institutional and retail participants across multiple market cycles, multiple decades, and multiple asset classes. They are not new. They are not obscure. They work because they reflect invariant truths about how large pools of capital accumulate and distribute positions – and those truths do not change as markets evolve.
What changes is the analytical rigour applied to them.
The VWAP bounce has been traded since VWAP was introduced as an execution benchmark in the 1980s. The cup and handle was codified by William O'Neil in the 1960s. Support and resistance levels have been identified by technical analysts for over a century. Most guides covering these setups miss the very thing this cluster provides: a quantitative layer that separates the high-probability configurations from the marginal ones. That means backtest data with real sample sizes, regime-specific performance numbers, position sizing tied to measurable stop distances, and failure mode analysis that tells the trader exactly when the setup is not working.
The Classic cluster is the foundational layer of the BreakoutBulletin architecture. Every Momentum, Options, Structure, and Advanced setup in the broader framework assumes proficiency in the analytical tools established right here – regime scoring, volume confirmation, Grade A quality standards, and the universal position sizing formula.
Current May 2026 context: The selective risk-off environment (regime score 2, VIX 16.99, upward-sloping term structure) makes the Classic cluster the primary trading vehicle. Support bounces at major EMAs, VWAP mean-reversion entries, and Grade A cup and handle bases approaching breakout are the highest-probability setups available in the current environment. Half-size position sizing applies across all nine setups until the regime advances to score 3.
The Four Filters Applied to Every Classic Setup
Before any Classic setup is entered, four filters are applied in sequence. If a setup fails any filter, it is not entered – regardless of how technically precise the pattern appears.
Filter One – Regime Score
The three-component regime scoring system determines position size and setup eligibility:
SPY above 20-day SMA → 1 point
VIX below 20 → 1 point
NYSE Advance-Decline line positive → 1 point
Score 3: Full size – all nine Classic setups viable
Score 2 (current): Half size – support bounces and VWAP preferred over breakout setups
Score 1: Paper trade only
Score 0: No new positions
Filter Two – Sector Leadership
The individual stock must belong to a sector showing relative strength versus the S&P 500 – above-average volume alongside improving performance across multiple sessions. A Grade A technical setup in a sector under active distribution has a materially lower win rate than the same setup in a leading sector. Sector context is assessed using the Participation Heatmap framework from the sector rotation guide.
Filter Three – Setup Grade
Every Classic setup uses a consistent A/B/C grading system. Grade A requires every measurable criterion to be met without exception. Grade B allows one marginal element. Grade C is a paper trade only. Maximum position size is reserved for Grade A setups in leading sectors during regime score 3. At the current regime score 2, even Grade A setups are sized at half the standard risk percentage.
Filter Four – Volume Confirmation
Volume confirmation thresholds by market cap tier:
Large-cap (above $10B): 40%+ above 50-day average on the entry candle
Mid-cap (2B–10B): 50%+ above 50-day average
Small-cap (below $2B): 75%+ above 50-day average
A technically perfect setup on below-threshold volume is not entered. Volume is the institutional participation signal – without it, the pattern reflects retail activity rather than the institutional accumulation that produces sustained moves.
The Universal Position Sizing Formula
Every Classic setup uses the same formula:
Shares = (Account × Risk%) ÷ Stop Distance
The risk percentage is regime-determined:
| Regime Score | Risk Per Trade |
|---|---|
| Score 3 | 1% of account |
| Score 2 (current May 2026) | 0.5% of account |
| Score 1 | 0.25% – paper trade threshold |
| Score 0 | No new positions |
The stop distance is setup-specific – defined within each individual guide. The combination of regime-determined risk percentage and setup-specific stop distance produces a mechanically calculated position size with no discretionary component.
The Nine Classic Setups
1. VWAP Bounce Strategy
The intraday mean-reversion framework built around the Volume Weighted Average Price – the single most widely used institutional execution benchmark in US equity markets. The VWAP bounce works because institutional algorithms use VWAP as both an execution target and a reference for assessing whether a position is being filled at a favourable or unfavourable price. When price pulls back to VWAP in a trending session, it pulls back to the level where the largest concentration of institutional interest has been expressed throughout the day.
The first touch of VWAP after a strong opening directional move is the highest-probability configuration – subsequent tests degrade in reliability as each test demonstrates that VWAP is failing to hold as support. The setup requires the stock to be in an established intraday trend (clear higher highs and higher lows above VWAP for long setups), the pullback to be on declining volume, and the bounce candle to show volume exceeding the prior session's average for that time of day.
Backtest data: n=1,247 qualifying SPY setups, January 2023-December 2025. Grade A win rate at regime score 3: 68%. At regime score 2 (current): 59%.
Current relevance: AMD's recent retest of the daily VWAP after a strong opening range breakout exemplifies the first-touch configuration. The pullback was on declining volume; the bounce candle showed 40%+ above average participation.
→ Complete VWAP Bounce Strategy Guide
2. Support and Resistance Bounce
The foundation of all technical trading – identifying price levels where institutional buyers have historically demonstrated willingness to absorb selling. The Level Quality Grading system in this guide ranks each support level from Grade A (three or more prior tests, round number or major moving average alignment, high volume on the level's establishment) to Grade C (single test, unclear level, low prior volume).
The Grade A support bounce is the highest-conviction single-session trade in the Classic cluster. When a stock tests a Grade A level on declining volume and produces a reversal candle – hammer, engulfing, or morning star – on above-threshold volume, the institutional demand that established the level is confirming its presence.
In the current score 2 regime, Grade A support levels are where the primary trading opportunity sits. Stocks testing major EMA levels (the 50-day and 200-day in particular) with strong fundamental underpinning in leading sectors are the primary focus for May 2026.
Backtest data: n=847 qualifying setups across Grade A and B levels, 2020-2025.
→ Complete Support and Resistance Bounce Guide
3. Pullback Trading Strategy
The trend-continuation framework using the three primary Fibonacci retracement levels – 38.2%, 50%, and 61.8% – to identify high-probability re-entry points in established uptrends. The pullback strategy assumes the primary trend is intact (price above all three major EMAs: 20, 50, and 200-day) and that the temporary retracement is a buying opportunity rather than a trend reversal signal.
The regime score determines which Fibonacci level to target. At score 3, all three levels are valid entry points. At score 2 (current), the 38.2% and 50% retracements are preferred – a 61.8% retracement in a score 2 environment suggests trend weakness rather than healthy consolidation and should be approached with caution or avoided entirely.
The volume signature during the pullback is the critical confirmation: declining volume on the pullback (indicating sellers are not aggressive), followed by rising volume on the first reversal candle at the Fibonacci level (indicating buyers are re-entering with conviction).
Backtest data: n=934 qualifying setups, January 2020-December 2025.
→ Complete Pullback Trading Strategy Guide
4. Cup and Handle Pattern
The institutional base-building structure codified by William O'Neil – the most thoroughly researched pattern in the Classic cluster and the one with the most rigorous Grade A criteria. The cup requires a minimum 6-week duration, 15-33% depth from the left-side high to the cup low, a U-shaped (not V-shaped) base, and a right-side high that approaches or matches the left-side high without exceeding it before the handle forms.
The handle is a minor consolidation of 1-4 weeks in the upper portion of the cup – depth no greater than one-third of the cup depth, volume declining throughout the handle formation. The RS line reaching a new high before the price breakout is the single most important pre-breakout signal. Institutional accumulation in the handle is reflected in the stock's relative strength versus the index improving even as price consolidates.
The CANSLIM fundamental criteria – earnings growth above 25%, rising institutional ownership, industry group leadership – are non-negotiable for Grade A classification. A technically perfect cup and handle in a stock with declining earnings and falling institutional ownership is a Grade C setup at best.
Base One configurations (the first base after an IPO or after a major price advance) produce the highest win rates. Each successive base in the same stock reduces the expected return as the remaining supply of motivated sellers diminishes.
Backtest data: n=612 qualifying Grade A and B setups, 2015-2025.
→ Complete Cup and Handle Pattern Guide
5. Moving Average Bounce Setups
The four-EMA framework covering bounces off the 8-day, 21-day, 50-day, and 200-day exponential moving averages – each with distinct entry mechanics, volume requirements, stop placement, and regime conditions. The four EMAs are not interchangeable. Each reflects a different timeframe of institutional interest and produces different risk-reward profiles.
The 8-day EMA bounce is the most aggressive – appropriate only in regime score 3 for stocks in strong uptrends. It produces the most frequent opportunities and the shortest holding periods. The 50-day EMA bounce is the primary focus in the current score 2 environment – it occurs after a meaningful pullback that tests institutional commitment to the position. The 200-day EMA bounce is the slowest and least frequent. When it works, it signals a major trend inflection; when it fails, the stock is in a structural downtrend.
The EMA stack alignment – 8-day above 21-day above 50-day above 200-day – is the prerequisite for any bullish EMA bounce setup. Bouncing at the 50-day EMA in a stock where the 8-day is below the 21-day is a lower-quality setup regardless of the volume signature.
→ Complete Moving Average Bounce Guide
6. Trendline Drawing and Trading
The skill-building guide that separates mechanical trendline identification from genuine analytical trendline use. Most traders draw trendlines incorrectly – connecting intraday wicks rather than closing prices, using fewer than two confirmed anchor points, drawing lines that fit the desired narrative rather than the actual price structure.
The diagnostic table in this guide covers the five most common trendline errors: the single-anchor line (not a trendline), the wick-to-wick connection (misleading), the forced angle (too steep or too flat to be sustainable), the retroactive redraw (fitting past data rather than projecting future levels), and the overextension (a trendline that has not been tested in 40+ sessions has likely lost its relevance).
The trading framework covers bounces off valid trendlines (entry on the first candle closing above the line after a test), breaks through valid trendlines (entry on the retest from the other side), and the volume signature that distinguishes genuine breaks from fakeouts.
→ Complete Trendline Drawing and Trading Guide
7. Consolidation Breakout Strategy
The flat base and tight consolidation framework – identifying the 3-8 week ranges where institutional accumulation is occurring in silence before the breakout candle reveals it to the broader market. The sequence story is the guide's central analytical contribution: accumulation within the range (declining volume, tight daily ranges, stock holding well above prior support) → the breakout candle (volume surge, close near session high, price clearing resistance) → the retest (pullback to the breakout level on declining volume, confirming support where resistance previously existed).
Two critical distinctions the guide makes explicit. The first is between a consolidation breakout (controlled, declining volume during formation, volume surge on breakout) and a momentum breakout (expanding volume throughout formation, breakout on continued acceleration). The entry mechanics, stop placement, and holding strategy differ for each.
In the current score 2 environment, consolidation breakouts require the higher end of the volume threshold – 50%+ above average for large-caps – before entry. Breakouts on marginal volume in a score 2 regime have historically shown a significantly lower success rate than the same setup at score 3.
→ Complete Consolidation Breakout Guide
8. Double Bottom Pattern
The reversal structure built on a simple but powerful psychological premise: a stock that tests a prior low and holds is showing that sellers at that level have been absorbed. The double bottom requires two lows at approximately equal price with a recovery rally between them – the neckline. The entry trigger is the neckline breakout on above-average volume, not the second low itself.
The volume signature distinguishes the genuine double bottom from the failed test. Volume on the second low should be lower than volume on the first low – indicating that fewer motivated sellers are present at the retest. The neckline breakout should show volume expansion – indicating buyers are more aggressive than at any prior point in the pattern's formation.
The three-act structure – first decline (sellers dominant), failed recovery (neither side decisive), second test with volume capitulation and reversal – is the psychological narrative that produces the pattern's edge. Understanding the psychology behind the pattern produces better judgment on marginal cases than any mechanical checklist alone.
Backtest data: n=534 qualifying setups, January 2020-December 2025.
→ Complete Double Bottom Pattern Guide
9. Round Number Support Levels
The behavioural finance and options market mechanics framework explaining why price levels ending in round numbers ( 50 ,100 ,150 ,200 and their subdivisions at $25 increments) produce measurably stronger support and resistance than arbitrary technical levels. Three simultaneous forces converge at round numbers: retail stop-loss and limit order concentration, institutional execution benchmarks, and options market maker delta hedging at the major strike prices.
The $100 level on any large-cap stock is not just a psychological barrier. It is the strike price with the highest open interest, the stop-loss level for the largest number of retail positions, and the limit order price for the most institutional accumulation programs. This mechanical concentration produces self-reinforcing support that backtest data confirms outperforms equivalent non-round-number support levels.
Backtest data: n=412 qualifying setups at major round numbers (multiples of 50onstocksabove50), n=287 at minor round numbers ($25 increments), 2018-2025.
→ Complete Round Number Support Levels Guide
Classic Setups Performance Comparison
At regime score 2 (current May 2026 conditions). All data from individual guide backtests – refer to each guide for full methodology.
| Setup | Regime Score 3 Win Rate | Regime Score 2 Win Rate | Best Condition |
|---|---|---|---|
| VWAP Bounce | 68% | 59% | First touch, intraday trend confirmed |
| Support Bounce | 71% | 63% | Grade A level, three prior tests |
| Pullback Strategy | 65% | 57% | 38.2-50% Fib, declining pullback volume |
| Cup and Handle | 68% | 59% | Base One, RS line at new high |
| EMA Bounce | 63% | 54% | 50-day EMA, stack aligned |
| Trendline Trading | 61% | 52% | Third anchor point, volume confirmation |
| Consolidation Breakout | 66% | 54% | 50%+ above average volume |
| Double Bottom | 64% | 56% | Neckline breakout, lower volume on second low |
| Round Number Support | 67% | 59% | 50 / 100 levels, options OI confirms |
The regime score 2 win rate reduction – approximately 8-12 percentage points across all setups – is the quantitative evidence for why the current environment requires half-size positioning and Grade A setup selection. The edge exists. It is simply smaller than in full risk-on conditions.
Which Setup for Which Condition
| Market Condition | Primary Setup | Secondary Setup | Avoid |
|---|---|---|---|
| Score 3, trending strongly | Cup and Handle | Gap and Go (Momentum) | None |
| Score 2, moderate trend | Support Bounce | VWAP Bounce | Aggressive breakouts |
| Score 2, sector rotating | EMA Bounce (50-day) | Pullback Strategy | New breakouts |
| Score 1, deteriorating | None – paper trade | Trendline study | All entries |
| Score 0, risk-off | No new positions | – | Everything |
| High-volume breakout day | Consolidation Breakout | Volume Breakout (Momentum) | Low-volume setups |
| Reversal candidate | Double Bottom | Round Number Support | Trend-following |
The Classic Cluster's Role in the Broader Architecture
The Classic cluster is the prerequisite for every other cluster in the BreakoutBulletin architecture. The Momentum cluster's pocket pivot and accelerating volume setups require understanding the volume confirmation standards established in the Classic guides. The Options cluster's regime-based position sizing uses the same score framework defined here. The Structure cluster's HH/HL and LH/LL frameworks determine when Classic setups are in their optimal operating environment. The Advanced cluster's Fibonacci and harmonic patterns are confluence layers added on top of Classic support and resistance levels.
The Power Momentum guide is the explicit integration point – its four-factor conviction scoring system uses Classic setup quality (Factor Three) as one of four inputs. A cup and handle that scores Grade A on the Classic quality criteria automatically scores 2/2 on the Power Momentum Factor Three – enabling the full 2× position sizing multiplier at regime score 3.
For the complete Trading Setups and Patterns overview covering all five clusters and 36 individual setup guides, see the Trading Setups and Patterns Master Guide.
BreakoutBulletin | Trading Education. Educational commentary only. Not investment advice. Win rate data sourced from individual setup guide backtests – refer to each guide for full methodology, sample sizes, and data ranges. VIX and regime data as of May 2026. Past performance does not guarantee future results.