
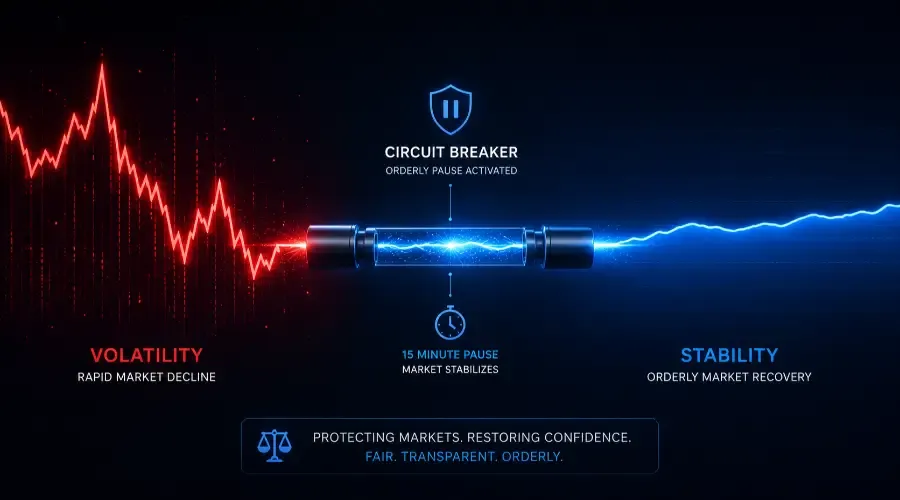
Markets occasionally pause mid-session. Understanding why – and what it means when they do – removes a category of panic that can lead to poor decisions at exactly the wrong moment.
Market-Wide Circuit Breakers
The U.S. Securities and Exchange Commission and the major exchanges maintain three market-wide circuit breakers, all measured as percentage declines from the S&P 500's prior-day closing level.
Level 1 triggers at a 7% decline. Trading halts for 15 minutes. After the pause, trading resumes normally. This breaker can only be activated before 3:25 PM Eastern Time – in the final 35 minutes of the session, the market trades through to the close regardless of the decline.
Level 2 triggers at a 13% decline. Trading halts for another 15 minutes. Same time restriction – only applies before 3:25 PM. Level 2 has never triggered in U.S. market history.
Level 3 triggers at a 20% decline. Trading closes for the remainder of the day with no time restriction – this one applies at any point during the session. Level 3 has never triggered.
Level 1 has triggered four times in total – all in March 2020 during the early weeks of the COVID-19 pandemic. On March 9, the S&P 500 fell 7% within four minutes of the open and trading paused for 15 minutes. Similar halts followed on March 12 and March 16. The market remained functional throughout – volatile, but orderly.
Individual Stock Halts
Individual stocks halt more frequently than the full market. The Limit Up/Limit Down (LULD) mechanism triggers when a stock moves more than a specified percentage within a five-minute window without trading activity at prices within that band. The percentage threshold varies by stock price tier: 5% for stocks above $3, 10% for stocks between $0.75 and $3.
When a LULD halt triggers, trading pauses for 5 minutes to allow participants to assess whether the move reflects genuine information or a technical anomaly – a fat-finger order, an algorithmic error, or a thin-market reaction to a single large trade.
After the 5-minute pause, trading resumes through an auction process that establishes a fair reopening price based on queued orders.
What to Do When a Halt Occurs
The instinct to act immediately is understandable but usually counterproductive. Halts exist specifically to provide time for assessment – using that time to read the news, check the company's investor relations page, and determine what triggered the move is exactly what the pause is designed to enable.
If the halt follows a significant news event – earnings, a regulatory decision, an acquisition announcement – the news itself tells you more than the price movement does. A 10% decline on a negative earnings report and a 10% decline on a technical error have very different implications for how you should respond at the resumption.
Market orders placed into a post-halt reopening auction can fill at prices substantially different from the pre-halt level. Limit orders, set with a specific maximum buy or minimum sell price, provide more control in these conditions.
Trading Halts vs. Trading Suspensions
These are different. A trading halt is automatic and mechanical – triggered by price movement thresholds. It lasts minutes. A trading suspension is regulatory, initiated by the SEC when it has concerns about the accuracy of public information, potential manipulation, or other investor protection issues. Suspensions can last up to 10 trading days.
A trading suspension is a materially more serious event than a circuit breaker halt. It indicates that the SEC has identified a specific concern serious enough to remove trading access entirely. Stocks that have been suspended by the SEC require substantially more scrutiny before any consideration of continued investment.
Historical Context
The circuit breaker system was created in response to Black Monday – October 19, 1987 – when the Dow Jones Industrial Average fell 22.6% in a single session. The 1987 crash revealed that markets could cascade rapidly without any mechanism to create a pause for information to spread and panic to subside.
The four Level 1 halts in March 2020 demonstrate the system functioning as designed. Each pause allowed some portion of panic selling to dissipate, news to circulate more broadly, and institutional participants to reassess conditions. The S&P 500 bottomed on March 23, 2020 – and recovered all losses by August 2020. Investors who sold into the three circuit breaker days locked in losses that a holding position would have recovered within five months.
This content is for educational purposes only and does not constitute investment, legal, or tax advice. Investing in securities involves risk, including possible loss of principal. Always conduct your own research and consult a licensed financial professional before making investment decisions.
Circuit breakers exist precisely for the moments when the instinct to act is strongest. The historical data on what happened after the March 2020 halts - the S&P 500 recovered fully within five months - is the most useful context for understanding why the pause exists.
→ Trading Timeframes and Strategies → How to respond to volatility across day trading, swing trading, and long-term positions - www.breakoutbulletin.com/article/trading-timeframes-strategies-day-swing-investing
→ Bull vs. Bear Markets → The broader context of sustained market direction and what drives each phase - www.breakoutbulletin.com/article/bull-vs-bear-markets-for-teens
→ Short Selling Basics → How short squeezes create the kind of extreme intraday volatility that triggers halts - www.breakoutbulletin.com/article/short-selling-basics-explained