
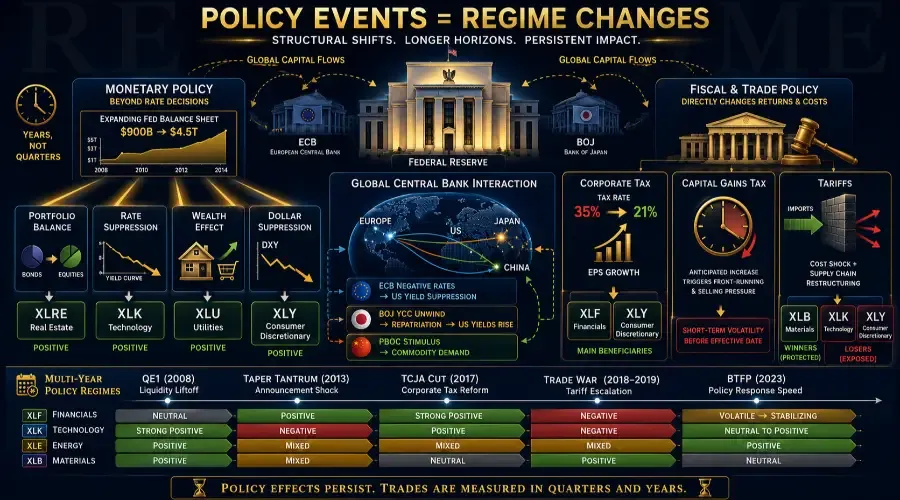
There is a fundamental difference between a market that is reacting to data and a market that is reacting to policy. Data releases – the CPI, the NFP, the GDP – tell you where the economy has been. Policy decisions change the rules under which the economy operates going forward.
That distinction changes everything about how you trade the event. A CPI miss is a one-day repricing. A corporate tax cut is a multi-year earnings re-rating. A QE program is a structural shift in the liquidity backdrop that affects every asset class for the duration of the program and years beyond. A tariff regime is a fundamental alteration of supply chain economics that companies spend quarters – sometimes years – adjusting to. If you’ve ever needed a quantitative easing explained alongside its sector-by-sector transmission, this hub is where you’ll find it.
Policy events are not catalysts. They are regime changes. And regime changes require a different analytical framework, a longer time horizon, and a more structural approach to sector positioning than any other category in this series. The whole central bank policy effects playbook – from QE and stock market regime shifts to the Fed tapering impact on stocks – plays out over quarters and years, not minutes and hours.
The Critical Distinction: Policy Events vs. Data Events
Hub 5 covered macroeconomic data releases – scheduled, measurable, consensus-driven events where the trade is built around the deviation from expectations. This hub covers something categorically different: deliberate interventions by governments and central banks that change the structural conditions of the market.
The implications of this distinction are significant:
Data events are mean-reverting. A hot CPI print does not stay hot forever. The economy adjusts, the Fed responds, and the inflation rate eventually normalizes. The sector rotation triggered by data events typically plays out over one to three quarters before reversing as the data itself reverses.
Policy events are persistent. A QE program that inflates the Fed's balance sheet from 900 billion to 4.5 trillion (as QE1 through QE3 did from 2008 to 2014) creates a new liquidity baseline that takes years to unwind. A corporate tax cut from 35% to 21% (as the 2017 TCJA delivered) permanently re-rates after-tax earnings for every US company – the sector implications do not fade in three quarters. A tariff regime that raises the cost of imported goods restructures supply chains that took decades to build.
This is why the posts in this hub require a longer forward time horizon than any other category in the series. The before/during/after framework here is not days and months – it is months and years.
Two Categories of Policy Event: Monetary vs. Fiscal and Trade
The eight events in this hub divide into two fundamentally different policy mechanisms, each with a distinct transmission pathway.
Category 1: Monetary Policy Beyond Rate Decisions
This category covers the tools central banks use beyond setting the overnight interest rate – quantitative easing, balance sheet expansion, yield curve control, and the policies of foreign central banks whose decisions affect global capital flows.
The QE transmission mechanism operates through four channels simultaneously:
The portfolio balance channel is the most important. When the Fed buys Treasury bonds and mortgage-backed securities, it removes duration risk from the market and forces investors who sold those securities to redeploy capital into riskier assets – equities, corporate bonds, real estate, and international assets. This is the direct mechanism by which QE inflates asset prices: it is not money printing in the traditional sense, it is forced risk-taking.
The rate suppression channel keeps long-term interest rates lower than they would otherwise be. This directly benefits rate-sensitive assets – real estate (XLRE), utilities (XLU), and long-duration growth stocks (XLK) – by reducing discount rates and making their future cash flows worth more in present value terms.
The wealth effect channel translates rising asset prices into consumer spending. Higher equity portfolios and home values make households feel wealthier and spend more – which supports consumer discretionary earnings and creates a second-order boost to the economy beyond the direct financial market impact.
The dollar suppression channel operates when the Fed is easing while other central banks are not. Expanding the Fed's balance sheet relative to peers weakens the dollar, which boosts commodity prices, benefits US multinational earnings, and stimulates emerging market capital inflows.
The tapering transmission reverses all four channels simultaneously – but more slowly than QE deployed them. The 2013 "Taper Tantrum" is the clearest case study: the mere announcement that the Fed was considering tapering its bond purchases sent the 10-year yield from 1.6% to 3.0% in four months and triggered a 15% collapse in emerging market equities. The actual tapering had not yet begun – the announcement alone was sufficient to begin unwinding the portfolio balance and dollar suppression effects. This is the classic taper tantrum explained in a single sentence: markets price the withdrawal before the Fed executes it.
Foreign central bank policy – ECB, BOJ, PBOC – matters because global capital flows toward the highest real yields and most stable policy environments. When the ECB moves to negative rates while the Fed is neutral, European capital flows into US assets, strengthening the dollar and compressing US long-term yields. When the BOJ abandons yield curve control (as it began doing in 2022–2023), Japanese capital that had been flowing into higher-yielding foreign bonds begins repatriating – weakening the yen, strengthening the dollar, and tightening financial conditions globally without any Fed action. In practice, the ECB policy impact on US stocks is a real, measurable variable every macro trader tracks.
Category 2: Fiscal and Trade Policy
This category covers government decisions on taxation and trade – events that directly change the after-tax return on investment and the cost structure of international commerce.
Corporate tax changes are the most mathematically direct policy event in financial markets. If a company earns 100 in pre−tax income, a corporate tax rate reduction from 3565 to $79 – a 21.5% increase in EPS with zero change in revenue or operations. This is why the 2017 TCJA produced an immediate and sustained re-rating of US equities: the earnings increase was real, certain, and applied to every US-domiciled company simultaneously. The corporate tax hike impact, conversely, runs the same math in reverse – and companies with the highest effective rates feel it the most.
The sector implications of corporate tax changes are not uniform. Companies with the highest effective tax rates (domestically-focused businesses with limited offshore tax optimization) benefit the most from rate reductions. Companies that have already optimized their tax structures through offshore arrangements (many large-cap technology and pharmaceutical companies) benefit less from rate reductions – and are most exposed to rate increases.
Capital gains tax changes are the most behaviorally complex fiscal event in this hub. Unlike corporate tax changes (which affect future earnings), capital gains tax changes primarily affect the timing of when investors realize existing gains. An announced capital gains tax increase creates a powerful incentive to sell appreciated assets before the higher rate takes effect – which is why proposed capital gains tax increases often produce the most concentrated short-term market volatility of any fiscal event, even when the long-term impact is relatively modest. A capital gains tax increase stocks selloff is often front-loaded in the pre-enactment window.
Tariff and trade war escalation operates through a cost shock mechanism that sits at the intersection of fiscal policy and supply chain economics. Tariffs are taxes on imports – which means the immediate cost falls on the importing company, not the foreign exporter (despite frequent political claims to the contrary). The sector transmission depends entirely on which industries are importing the tariffed goods. The trade war market impact is never just a one-time hit; it compounds through supply chain restructuring.
Sector Reaction Map: Policy Events by Category
(For quick reference: XLRE=Real Estate, XLK=Technology, XLU=Utilities, XLY=Consumer Discretionary, XLI=Industrials, XLE=Energy, XLB=Materials, XLF=Financials, XLP=Consumer Staples, XLV=Healthcare.)
QE Expansion
Real Estate
XLRE → Strong Positive
Immediate → Rate suppression + portfolio balance
Technology
XLK → Strong Positive
Immediate → Rate suppression (growth duration)
Utilities
XLU → Positive
Immediate → Rate suppression
Consumer Disc.
XLY → Positive
1–3 Months → Wealth effect
Industrials
XLI → Positive
1–3 Months → Credit availability + capex
Energy
XLE → Positive
1–3 Months → Dollar weakness + commodity prices
Materials
XLB → Positive
1–3 Months → Dollar weakness + commodity prices
Financials
XLF → Moderate Positive
Immediate → Credit expansion (but NIM compression)
Consumer Staples
XLP → Neutral
– → Already defensive – less beta to liquidity
Healthcare
XLV → Neutral
– → Defensive sector – lower liquidity beta
QE Tapering / Balance Sheet Reduction
Real Estate
XLRE → Significant Negative
Immediate → Rate normalization
Technology
XLK → Significant Negative
Immediate → Duration compression
Utilities
XLU → Negative
Immediate → Rate normalization
Financials
XLF → Moderate Positive
1–3 Months → NIM expansion potential
Energy
XLE → Mixed
– → Dollar strengthening offsets commodity
Consumer Staples
XLP → Relative Positive
1–3 Months → Defensive rotation
Healthcare
XLV → Relative Positive
1–3 Months → Defensive rotation
Corporate Tax Rate Hike
Financials
XLF → Most Negative
Banks (highest effective rates)
Consumer Disc.
XLY → Significant Negative
Domestic retailers
Industrials
XLI → Significant Negative
Domestic manufacturers
Technology
XLK → Moderate Negative
Less exposed (offshore optimization)
Healthcare
XLV → Moderate Negative
Pharma (mixed – offshore exposure varies)
Energy
XLE → Moderate Negative
Domestic producers most exposed
Materials
XLB → Negative
Domestic mining and chemicals
Tariff Escalation
Technology
XLK → Significant Negative
Hardware, semiconductors – China supply chains
Consumer Disc.
XLY → Significant Negative
Retail importers, auto supply chains
Industrials
XLI → Moderate Negative
Machinery components, steel users
Materials
XLB → Moderate Positive
Domestic steel, aluminium producers (protected)
Energy
XLE → Mixed
Retaliation risk to LNG exports
Consumer Staples
XLP → Moderate Negative
Agricultural export retaliation
Financials
XLF → Negative
Slower growth, credit risk
The Global Central Bank Interaction: When Foreign Policy Becomes Your Problem
One of the most consistent mistakes retail traders make is treating Fed policy as if it operates in isolation. It does not. The Fed's decisions interact with the European Central Bank, the Bank of Japan, the People's Bank of China, and the Bank of England in ways that directly affect US asset prices through capital flows, currency dynamics, and global risk sentiment.
The ECB negative rate experiment (2014–2022) is the definitive case study. When the ECB pushed rates below zero while the Fed was neutral-to-tightening, the interest rate differential drove massive capital flows from Europe into US Treasuries – suppressing US long-term yields below where they would otherwise have been. This contributed directly to the extended duration of the post-GFC US growth cycle and the outperformance of US rate-sensitive assets (XLRE, XLK) relative to their international peers throughout 2015–2021. Understanding European monetary policy was essential context for any trade on US XLRE or XLK during this period.
The BOJ Yield Curve Control (YCC) unwind (2022–2024) is the most recent example of foreign central bank policy creating US market volatility. The BOJ had capped the 10-year Japanese government bond yield at 0.25% since 2016. When it began allowing yields to rise above that cap in late 2022, Japanese institutions – which had been buying higher-yielding foreign bonds (including US Treasuries) to escape the zero-yield domestic environment – began repatriating capital. This repatriation put upward pressure on US Treasury yields independent of any Fed action and contributed to the global rate volatility of 2023. The yen strengthening sharply on YCC adjustment days was the real-time signal that repatriation flows were active. The BOJ yield curve control explained simply: when it unwinds, global capital flows reverse.
PBOC stimulus operates through different channels than Western central bank easing. Chinese monetary stimulus (reserve requirement ratio cuts, policy rate reductions, directed lending programs) primarily flows into infrastructure spending and property market support – which stimulates global commodity demand rather than directly inflating financial asset prices. PBOC stimulus impact is therefore most immediately bullish for XLB and XLE (commodity sectors) and for commodity-exporting emerging market currencies. It is less directly bullish for US equity multiples – the transmission is through global growth and commodity prices, not through US financial conditions.
Key Historical Policy Events and What They Produced
2008–2014: The QE Era – Three Programs, One Liquidity Tide
QE1 (November 2008 – $600bn), QE2 (November 2010 – $600bn), and QE3 (September 2012 – open-ended at $85bn/month) collectively expanded the Fed's balance sheet from $900bn to $4.5 trillion. The aggregate sector impact across this period was decisive: XLK gained over 200%, XLRE recovered its GFC losses completely, and XLU delivered consistent outperformance. The correlation between Fed balance sheet expansion and S&P 500 performance was the dominant market relationship of the era. The 2013 Taper Tantrum – when Bernanke's May 2013 congressional testimony hinting at tapering sent the 10-year yield up 140 basis points in three months – demonstrated how sensitive the QE-inflated market had become to any threat of liquidity withdrawal.
2017: The TCJA Corporate Tax Cut
The Tax Cuts and Jobs Act reduced the US corporate tax rate from 35% to 21% – the most significant corporate tax reduction in US history. The immediate market impact was a broad re-rating of US equities, with the S&P 500 gaining approximately 22% in the months surrounding the passage. The sector most directly benefited was not technology (which had extensive offshore tax optimization) but Financials (XLF) – banks had the highest effective tax rates of any sector and the clearest, most quantifiable EPS benefit from the rate reduction. Small-cap domestic companies (which could not access offshore tax structures) also dramatically outperformed large-cap multinationals in the first two quarters following the cut.
2018–2019: The US-China Trade War
The Trump administration's tariff escalation – beginning with steel and aluminum tariffs in March 2018 and escalating to 25% tariffs on $250bn of Chinese goods by May 2019 – produced the clearest modern case study of tariff transmission into equity sectors. XLK fell sharply as semiconductor and hardware companies with deep China supply chains faced both direct cost increases and retaliation risk. XLY retailers with China-heavy sourcing (notably Gap, Nike, and department stores) underperformed. The domestic steel and aluminum producers within XLB were the clearest winners – protected from foreign competition by the tariff barrier. Soybean prices collapsed as China imposed retaliatory tariffs on US agricultural exports, directly hitting XLP names with significant soy exposure.
2023: The US Regional Banking Stress – Policy Response Speed Test
When Silicon Valley Bank failed in March 2023, the Fed and FDIC deployed the Bank Term Funding Program (BTFP) within 72 hours – providing emergency liquidity to prevent a broader banking contagion. This was the fastest deployment of a new policy tool since the GFC. The market impact illustrated the power of policy response speed: XLF fell 8% in the week of SVB's failure, then largely stabilized as the BTFP backstop became credible. Regional bank stocks (within XLF) remained under pressure for two additional quarters as the credit quality concerns proved more persistent than the liquidity crisis – a reminder that policy can address liquidity but not solvency.
How to Trade Policy Events: The Extended Three-Phase Checklist
Policy events require a modified checklist that accounts for their longer duration and structural nature. One practical note: policy announcements – especially surprise ones – can trigger sharp intraday moves. Position with defined risk or reduced size before the release; the structural trade is durable enough to build into, not chase.
Before a policy event:
Determine whether the event is monetary or fiscal/trade – the transmission mechanism and sector targets differ fundamentally
For QE/tapering: check current balance sheet trajectory (Fed H.4.1 release weekly) and market pricing of future balance sheet path
For tax events: calculate the effective tax rate delta for your highest-conviction holdings – companies with the highest effective rates face the largest impact in either direction
For tariff events: identify the specific tariff schedule, which goods are targeted, and which companies have the highest import exposure from the affected countries
For government shutdown: identify which government contractor names within XLI have the highest federal revenue dependency
During the policy announcement:
For monetary policy: watch the balance sheet announcement details – the pace of QE or tapering matters more than the decision itself for sector positioning
For tax policy: focus on the effective date and phase-in schedule – immediate implementation vs. phased creates very different timing for sector rotation
For tariffs: watch for retaliation announcements – the retaliatory response from the affected country often produces the largest equity market impact for US exporters
After the policy event (the multi-quarter duration trade):
Policy effects compound – set quarterly reminders to assess whether the structural impact is accelerating or decelerating
Watch for policy reversal risk: tariff regimes and tax policies change with administrations; QE programs have historically been extended beyond initial guidance. Build position sizing that accounts for reversal risk
Track the unintended consequences: the 2018 steel tariffs reduced Chinese steel imports but raised input costs for US manufacturers – monitor both the intended protection effect and the unintended cost effects simultaneously
Trading from outside the US? The same policy transmission logic applies globally – use local sector indices or sovereign bond ETFs to track equivalent impacts; a eurozone QE program shifts capital flows just like the Fed's version
Eight Policy Events Covered in This Hub
→ What Happens When the Fed Expands Its Balance Sheet (QE)
The definitive guide to quantitative easing transmission: the four channels (portfolio balance, rate suppression, wealth effect, dollar suppression), the sector leadership playbook across QE1/QE2/QE3, and the distinction between QE as crisis tool versus QE as growth stimulus. [link]
→ What Happens When the Fed Starts Tapering QE
The 2013 Taper Tantrum is the primary case study – specifically the gap between the announcement impact and the actual tapering impact. Covers the EM vulnerability framework, rate-sensitive sector rotation, and why tapering is rarely as damaging as the initial announcement suggests. [link]
→ What Happens When the ECB or BOJ Shifts Policy
Covers the capital flow implications of European and Japanese central bank policy changes for US assets – particularly the yield differential trade, the yen carry trade unwind risk, and the BOJ YCC adjustment case study. [link]
→ What Happens When China's PBOC Stimulates the Economy
Covers PBOC stimulus transmission through commodity demand rather than financial conditions – why PBOC easing is bullish for XLB and XLE before it is bullish for US equities broadly, and why Chinese property market stimulus has different implications than infrastructure stimulus. [link]
→ What Happens When Corporate Tax Rates Are Hiked
The 2017 TCJA cut as the primary case study for the inverse – covers the effective tax rate differential between sectors, the domestic vs. multinational exposure split, and the earnings re-rating math that makes corporate tax changes uniquely quantifiable. [link]
→ What Happens When Capital Gains Taxes Rise
The behavioral complexity post – covers the pre-announcement selling dynamic, the concentration in high-appreciation assets, and the historical evidence that capital gains tax increases produce short-term volatility that reverses once the selling pressure clears. [link]
→ What Happens When Tariffs and Trade Wars Escalate
Covers the 2018–2019 US-China trade war as the primary case study – sector winners (domestic steel, aluminium) and losers (semiconductors, retailers, agricultural exporters), the retaliation sequence, and the supply chain restructuring trade that plays out over multiple years after a tariff regime is established. [link]
→ What Happens When a US Government Shutdown Occurs
The most misunderstood policy event in this hub. Covers why shutdowns are consistently overstated as market risks, the specific sectors with genuine exposure (defense contractors within XLI, government services), the historical track record of markets ignoring shutdowns, and the genuine risk scenario where a shutdown coincides with a debt ceiling breach.
Continue Through the Catalyst Series
→ Pillar: The Complete Market Catalyst Framework
→ Hub 1: Energy Commodities – Oil, Gas, Uranium
→ Hub 2: Industrial & Base Metals – Copper, Steel, Lumber
→ Hub 3: Precious Metals – Gold, Silver, Platinum
→ Hub 4: Agricultural Commodities – Wheat, Corn, Soybeans
→ Hub 5: Macroeconomic Events – Fed, CPI, NFP, GDP
→ Hub 7: Geopolitical Events – Wars, Elections, OPEC, EM Crisis
Frequently Asked Questions
Q1. What is Quantitative Easing (QE)?
Quantitative Easing (QE) is a monetary policy where the Federal Reserve buys government bonds and other assets to inject liquidity into the financial system, lower interest rates, and stimulate economic growth.
Q2. Which sectors benefit the most from QE?
Technology, real estate, utilities, and consumer discretionary sectors usually benefit the most from QE because lower interest rates increase valuations and encourage risk-taking.
Q3. What happens when the Fed starts tapering QE?
When the Fed starts tapering QE, liquidity support gradually reduces, Treasury yields often rise, and rate-sensitive sectors like technology and real estate can face pressure.
Q4. Why did the 2013 Taper Tantrum happen?
The 2013 Taper Tantrum happened after the Federal Reserve hinted at reducing bond purchases, causing bond yields to surge and triggering sharp declines in emerging markets and rate-sensitive assets.
Q5. How do tariffs affect the stock market?
Tariffs increase import costs for companies, disrupt supply chains, and reduce corporate margins. Technology, retail, and industrial sectors are often negatively affected during trade wars.
Q6. Which sectors benefit from tariffs?
Domestic steel, aluminum, and certain materials companies may benefit from tariffs because foreign competition becomes more expensive.
Q7. How do corporate tax cuts impact stocks?
Corporate tax cuts increase after-tax earnings, boost EPS, and can lead to higher stock valuations across multiple sectors. Financials and domestic companies often benefit the most.
Q8. What happens when capital gains taxes rise?
Capital gains tax increases often trigger short-term selling pressure as investors try to lock in profits before higher tax rates take effect.
Q9. Why does ECB or BOJ policy matter for US markets?
Policies from the ECB and BOJ affect global capital flows, currency markets, bond yields, and investor risk appetite, which directly influences US stocks and Treasury markets.
Q10. How does PBOC stimulus affect global markets?
PBOC stimulus typically boosts commodity demand, infrastructure spending, and global growth expectations, benefiting energy and materials sectors first.
All content on BreakoutBulletin is for educational purposes only and does not constitute financial advice or a recommendation to buy or sell any security.