
BreakoutBulletin | BB Macro Intelligence Series
Part of the Macro Intelligence Master Guide
Educational commentary only. Not investment advice.
A Recession Is Not a Correction – That Distinction Changes Everything
Most traders treat a market correction and a recession as the same event. They are structurally different environments that require different analytical frameworks.
A correction is driven by sentiment, valuation compression, or short-term triggers. A recession reflects a deeper economic slowdown where GDP contracts, unemployment rises, and corporate earnings actually decline – not because multiples compress, but because the underlying revenue is weaker.
In a correction, defensive stocks outperform because capital rotates out of risk. In a recession, they outperform because their earnings remain stable while others deteriorate. That distinction shifts the framework from tactical positioning to earnings durability analysis.
What Actually Happens to Stock Earnings During a Recession
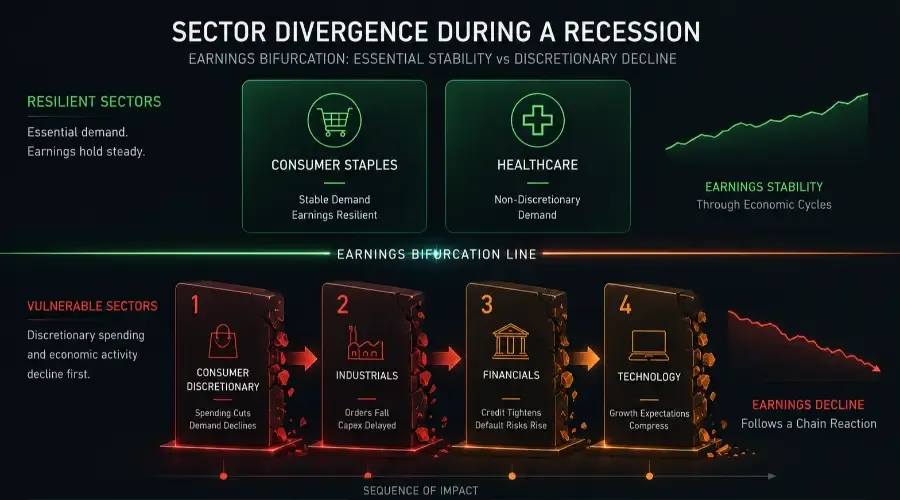
The surface-level observation – growth stocks fall, defensives hold – misses the more important mechanism: earnings bifurcation.
During a recession, businesses tied to discretionary spending experience real revenue declines. Travel slows. Luxury demand weakens. Industrial activity contracts. Capital spending gets deferred. At the same time, companies providing essential goods and services continue generating stable earnings because their customers have no alternative.
This divergence is where institutional capital repositions – typically before the recession is officially confirmed through economic data. By the time the NBER declares a recession, sector leadership has often already shifted. The Risk-On vs Risk-Off framework captures this transition through observable signals: credit spread widening, VIX expansion, and defensive sector relative strength – all of which tend to precede official confirmation by several months.
As of 2026, Consumer Staples and Healthcare are showing earnings estimate stability relative to the broader market, while discretionary and industrial sector estimates are being revised lower – consistent with early-stage earnings bifurcation.
How Recession Pressure Spreads: The Chain Reaction Model
Recessions do not impact all sectors simultaneously. They move through the economy in a sequence, and identifying where that sequence currently sits provides analytical context for sector positioning.
Stage 1 – Consumer Discretionary: Households reduce spending on non-essential items first. Travel, luxury goods, restaurants, and entertainment see the earliest revenue declines.
Stage 2 – Industrials: As consumer demand slows, production orders fall. Manufacturing activity contracts. Capital expenditure plans get deferred or cancelled.
Stage 3 – Financials: Credit conditions tighten as loan demand slows and default risks rise. Net interest margins can improve initially, but credit loss provisions increase.
Stage 4 – Technology: Growth expectations compress as revenue visibility decreases and enterprise software budgets face scrutiny. The valuation compression mechanism from rising rates – covered in Why Rising Interest Rates Hurt Growth Stocks – accelerates when earnings revisions turn negative.
Defensive sectors – Consumer Staples, Healthcare, Utilities – typically feel pressure last and least, because their revenue depends on necessity rather than confidence.
Tracking which stage the economy is currently in helps calibrate how much potential remains in defensive positioning and when cyclical sectors may begin attracting capital again.
The Three Sectors With the Strongest Recession Track Record
Consumer Staples
Consumer Staples companies sell products households continue purchasing regardless of economic conditions: groceries, household cleaning products, personal care items, and beverages. Revenue stability comes from the non-discretionary nature of the spending, not from brand strength alone.
During the 2008 financial crisis, Consumer Staples earnings fell roughly 5% while S&P 500 earnings fell 23%. In 2022, the Consumer Staples Select Sector ETF (XLP) gained approximately 1% while the S&P 500 fell 19%.
Companies in this sector often experience market share gains during downturns as consumers trade down from premium brands to value-oriented options – which still sit within the same consumer staples universe. Procter & Gamble (PG), Walmart (WMT), and Coca-Cola (KO) are frequently referenced names in institutional research on recession positioning.
Key ETF: Consumer Staples Select Sector ETF (XLP)
Healthcare
Healthcare demand is driven by medical necessity rather than consumer confidence, which structurally decouples it from the economic cycle. Patients do not defer cancer treatment or essential prescriptions because GDP is contracting.
The sector spans pharmaceuticals, medical devices, hospital systems, and health insurers – each with different risk profiles but all sharing the non-discretionary demand characteristic. During the 2008 recession, healthcare significantly outperformed the broader market. During 2022, the Health Care Select Sector ETF (XLV) fell roughly 3% against the S&P 500's 19% decline.
Key ETF: Health Care Select Sector ETF (XLV)
Utilities
Utilities generate predictable revenue from regulated services – electricity, water, and gas – with demand that is structurally insensitive to economic cycles. Their regulated business models limit both earnings upside and downside.
The primary risk for utilities in a recession context is interest rate behaviour. Falling rates during a recession typically improve utilities' relative attractiveness by reducing the competition from bond yields – the opposite of the 2022 environment, where rising rates and the recession-risk trade created conflicting forces. The dividend yield arithmetic that drives this dynamic is covered in detail in Defensive Stocks Explained.
Key ETF: Utilities Select Sector ETF (XLU)
Sector Performance: Historical Recession Comparison
| Sector | 2008 Crisis | 2022 Bear Market | Mechanism |
|---|---|---|---|
| Consumer Staples | -15% vs S&P -38% | +1% vs S&P -19% | Non-discretionary demand |
| Health Care | -23% vs S&P -38% | -3% vs S&P -19% | Medical necessity |
| Utilities | -29% vs S&P -38% | -1% vs S&P -19% | Regulated revenue |
| Technology | -43% vs S&P -38% | -33% vs S&P -19% | Growth expectations + rate sensitivity |
| Consumer Discretionary | -33% vs S&P -38% | -37% vs S&P -19% | Spending cuts hit directly |
| Energy | -35% vs S&P -38% | +59% vs S&P -19% | 2022 driven by geopolitical supply shock |
Note: 2008 figures approximate full-cycle peak-to-trough. 2022 figures reflect calendar-year returns.
Energy's 2022 performance illustrates a structural caveat: commodity supply shocks can override the typical recession playbook. A recession paired with an energy supply crisis produces a different sector leadership pattern than a recession in a normal supply environment.
How to Identify Genuinely Recession-Resistant Stocks
Not all companies within defensive sectors carry equal resilience. Three financial metrics separate the structurally durable from the superficially stable.
Earnings revision direction – When a company's earnings estimates hold steady or improve while the broader market faces widespread downgrades, that stability reflects genuine revenue durability. Consensus estimate tracking through FactSet or Bloomberg reveals this in real time.
Free cash flow margin – Earnings per share can be influenced by accounting adjustments. Free cash flow reflects actual cash generated after operating expenses and capital expenditure. Companies with free cash flow margins above 10% historically sustain dividends and avoid balance sheet stress during downturns.
Debt-to-equity ratio – In a tightening credit environment, companies with lower leverage are better positioned. Debt-to-equity ratios above 150% become increasingly problematic when refinancing costs rise. For capital-intensive sectors like utilities, the comparison should be made within the sector rather than against the broader market.
Payout ratio – For dividend-paying defensives, payout ratios below 70% signal a comfortable margin of safety. Above 80%, dividends face vulnerability if earnings soften. This metric appears in quarterly earnings reports and annual filings.
Recession vs Correction: A Positioning Framework
| Factor | Market Correction | Recession |
|---|---|---|
| Driver | Sentiment, valuation, short-term triggers | GDP contraction, rising unemployment, earnings declines |
| Duration | Weeks to months | Quarters to years |
| Earnings impact | Multiple compression, not fundamental | Actual revenue and earnings decline |
| Defensive appeal | Tactical – capital rotating out of risk | Structural – earnings stability has fundamental value |
| Recovery timing | Often sharp and fast | Gradual, follows economic re-acceleration |
| Key metric to watch | Valuation multiples, sentiment indicators | Earnings revision direction, free cash flow |
The practical implication: a correction resolves when sentiment normalises. A recession resolves when earnings begin recovering – which typically requires unemployment to stabilise and consumer confidence to rebuild. Historically, recession positioning has required longer time horizons than correction positioning.
Where We Are Now: 2026 Context
Several signals in early 2026 are consistent with late-cycle conditions rather than a mid-cycle correction.
February's payrolls report showed a surprise decline of 92,000 jobs – the first negative print in 18 months. The yield curve remains partially inverted. Credit spreads on high-yield debt have widened approximately 80 basis points since January. Consumer confidence surveys are declining.
Whether these signals develop into a confirmed recession depends on whether the labour market deterioration continues and whether consumer spending holds. The Market Regime Identification Framework provides the structured process for tracking these signals – VIX levels, credit spreads, advance-decline line behaviour, and the market's reaction to economic data – which together determine whether current conditions represent a selective risk-off environment or the beginning of a full risk-off regime.
These signals reflect conditions as of early 2026 and should be reassessed as new data becomes available.
Risk Factors: What Can Go Wrong With Defensive Positioning
No sector is structurally immune to a severe economic downturn. Defensive sectors still decline during extreme liquidity stress – they decline less, but the protection is relative, not absolute.
Three specific risks apply to recession-oriented defensive positioning:
Rate environment mismatch – If a recession is accompanied by persistently elevated inflation, central banks may not cut rates, which removes one of the typical tailwinds for utilities and rate-sensitive defensives.
Valuation starting point – If defensive sectors have already re-rated significantly higher before the recession is confirmed, much of the relative outperformance has already occurred. If defensives have already re-rated 15–20%, the margin of safety is narrower.
Recession severity – In extreme downturns like 2008, even defensive sectors experienced significant drawdowns. Consumer Staples fell 15% and utilities fell 29%, despite significantly outperforming the broader market. Capital preservation is relative in severe recessions, not absolute.
Key Takeaways
| Concept | Summary |
|---|---|
| Correction vs recession | Different mechanisms require different frameworks – sentiment vs earnings durability |
| Earnings bifurcation | The core recession dynamic: discretionary earnings fall, essential-service earnings hold |
| Chain Reaction sequence | Discretionary → Industrials → Financials → Technology; Defensives last and least |
| Top sectors | Consumer Staples (XLP), Healthcare (XLV), Utilities (XLU) |
| Stock screening criteria | Earnings revision stability, FCF margin above 10%, payout ratio below 70%, low leverage |
| 2026 signals | Negative payrolls print, widening credit spreads, yield curve inversion – late-cycle indicators |
| Primary risk | Rate environment mismatch if inflation stays elevated; valuation if defensives already re-rated |
Go Deeper: Breakout Bulletin Macro Intelligence Series
- The Sorting Hat for Stocks – Master guide to all four macro stock groups
- Defensive Stocks Explained – How defensive sectors work across different market environments
- Risk-On vs Risk-Off Markets Explained – Identifying the regime transition before it becomes obvious
- Market Regime Identification Framework – Tracking the signals that confirm recession-level risk-off conditions
- Daily Market Analysis Framework – Applying macro signals in a structured daily process
This article is published by BreakoutBulletin for educational purposes only. It does not constitute investment advice or a recommendation to buy or sell any security. Sector performance during recessions varies across economic conditions and time periods. All historical figures are approximate and provided for illustrative purposes only. Past performance is not indicative of future results. BreakoutBulletin is an educational content platform and is not a registered investment advisor, broker-dealer, or financial institution.