
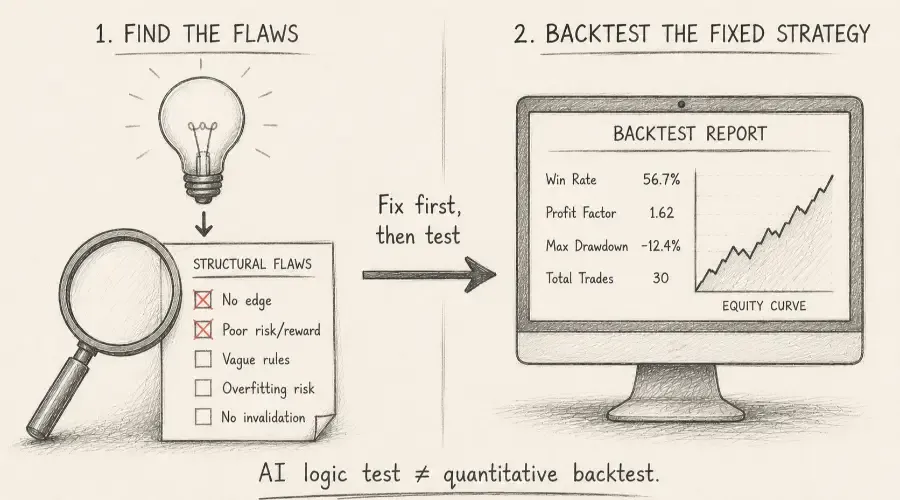
Every trader has had a strategy idea that felt compelling. A specific pattern, a defined entry trigger, a clear exit rule – something that seemed to work consistently in recent conditions and looked like it might have edge.
The question every trader faces at that point is how to know whether the idea actually has edge before committing real capital to finding out.
True quantitative backtesting requires either programming skills, a platform like TradingView with Pine Script, or a specialist tool with a learning curve. Most retail traders don't have those at the moment an idea occurs to them. AI offers an earlier-stage process: logic testing. Not true quantitative backtesting – but something that's often more valuable at the idea stage: identifying structural flaws, market condition dependencies, and curve-fitting risks before those problems show up in real trades.
Logic testing is the first filter. Quantitative backtesting is the second. Most strategy ideas don't need to reach the second filter because the first one catches the fatal flaw.
Strategy logic testing is the fourth application in the Strategy-Specific Applications with AI hub. It covers why strategy-specific AI use outperforms generic analysis and how the alignment principle applies to backtesting too.
What AI Can and Cannot Do
AI logic testing can:
- Evaluate internal consistency – whether entry and exit conditions are logically coherent and whether rules would produce the intended behaviour across different market conditions
- Identify structural weaknesses without historical data – slippage risk, market condition dependencies, curve-fitting patterns
- Apply the strategy's rules to described historical scenarios as a structured thought experiment
- Flag implicit assumptions about market behaviour the strategy hasn't made explicit
AI logic testing cannot:
- Run a strategy through actual historical price data or return a precise win rate, Sharpe ratio, or maximum drawdown
- Replace statistical validation – that belongs on TradingView or a dedicated platform
- Account for survivorship bias (only testing stocks that still exist today) or look-ahead bias (using data that wasn't available at the time of the trade) – both of which can make a manual strategy appear more profitable than it actually was
- Guarantee accuracy on specific historical dates – AI's recall of specific market conditions from training data may be incomplete. Always verify historical scenario outputs against actual charts before treating them as reliable
The right mental model: AI logic testing tells you whether the idea is worth testing properly. Quantitative backtesting tells you whether it actually works.
How to Describe a Strategy for AI Evaluation
The quality of a logic test depends entirely on precision. A vague description produces a vague assessment. A complete strategy description contains five elements:
- Universe – which instruments? US equities above a market cap threshold? S&P 500 constituents only? Liquid ETFs? This determines what liquidity assumptions are valid.
- Entry conditions – specific, binary, observable criteria. Not "the stock looks strong" – that's a judgment. "The stock has gapped up more than 3% pre-market with volume at least 2x the 20-day average" – that's a rule.
- Entry timing – at the open, at a specific time, on a price trigger after the initial condition? Entry timing determines the execution environment and slippage exposure.
- Exit rules – both profit-taking and loss-limiting exits. Exit rules are where most strategy ideas are most vaguely defined, and where most structural problems live.
- Intended market environment – what conditions is the strategy designed for? Trending? Range-bound? High-volatility? Making this explicit is the first step toward identifying when the strategy will and won't work.
The Structural Analysis Prompt
Act as a quantitative trading strategist evaluating the logic and
structural soundness of the following trading strategy.

I want you to identify structural weaknesses, curve-fitting risks,
market condition dependencies, and execution assumptions – not to
tell me whether the strategy will be profitable, but to identify
the design problems I should address before quantitative testing.

Strategy description: [paste complete rules]

(1) Identify structural flaws – internally inconsistent rules,
    conflicting conditions, or exit logic that would produce
    unintended behaviour in specific price scenarios.

(2) Identify curve-fitting risks – parameters specific enough
    to have been calibrated around historical data rather than
    motivated by a durable market dynamic. Flag any parameter
    that would change the strategy's character significantly
    if adjusted slightly.

(3) Identify market condition dependencies – what must be true
    about the market for this strategy to have edge? What
    conditions would cause it to fail systematically?

(4) Flag survivorship bias and look-ahead bias risks – does
    the strategy rely on instruments that existed throughout
    the test period? Do any entry conditions use data that
    wouldn't have been available at the time of the trade?

(5) Identify execution assumptions – what does this strategy
    implicitly assume about liquidity, fill quality, and slippage?
    Where are the most likely points of execution risk?

(6) State the single structural weakness most likely to cause
    underperformance in live trading versus theoretical expectancy.

Do not suggest changes – only identify the problems. Preserve the
strategy's rules exactly as described.
The Historical Scenario Test
After the structural analysis, apply the strategy's rules to a specific known market period. This is a structured thought experiment using described historical conditions – not statistical backtesting.
I want to apply the strategy I've described to the following
historical period: [e.g., October 2022 – choppy declining market,
high volatility, no sustained trending moves].

Relevant market data from that period: [paste ETF performance,
index levels, volatility readings, key macro conditions]

Important: frame your response as a thought experiment based on
the strategy logic and the described market conditions. Do not
rely on specific price data from memory – verify any specific
figures I haven't provided against actual charts before treating
them as reliable.

(1) Would the strategy's entry conditions have triggered frequently,
    rarely, or not at all? Why?
(2) Would the market conditions of this period have been conducive
    to the exit rules producing their intended outcome?
(3) Which specific characteristic of this period would have been
    most challenging – and is that consistent with the market
    condition dependency identified in the structural analysis?
The Robustness Standard
A strategy should demonstrate positive expectancy across at least three different market regimes to be considered robust for no-code strategy testing purposes:
- A trending market environment
- A ranging or choppy market environment
- A high-volatility or stress market environment
"Positive expectancy" means the strategy's logic should produce more winning scenarios than losing ones in each regime – not merely "not catastrophic." A strategy that survives trending markets but breaks even in choppy conditions and loses systematically in stress environments is not robust. It's regime-dependent, and it will face those other environments regularly over any multi-year trading horizon.
A sample size below 30 trades is typically insufficient to draw meaningful statistical conclusions from quantitative backtesting. A strategy generating one signal per month requires 30 months of data to reach a meaningful sample. This is precisely where AI logic testing adds the most value – for low-frequency strategies, testing structural soundness in advance avoids spending months on a strategy with a fatal design flaw.
When to move from AI logic testing to quantitative backtesting: if AI finds no fatal structural flaws, the three-regime logic holds across the thought experiment, survivorship and look-ahead bias risks have been addressed in the strategy design, and the entry and exit rules are precise enough to be coded without ambiguity – those are the green light criteria for moving to TradingView or a dedicated backtesting platform.
Knowing a strategy is structurally sound is one thing. Following it consistently through losing sequences is another. How to Use AI for Trading Psychology and Bias Checks covers how to identify the psychological patterns that appear when a strategy underperforms and build the structural rules that address them.
Gap-and-Go Strategy – Complete Logic Test Walkthrough
Strategy description: S&P 500 constituents only. Entry condition: stock has gapped up more than 3% pre-market on its earnings release date, with pre-market volume at least 2x the 20-day average daily volume. Entry timing: market open (9:30am ET). Exit: 30 minutes after entry (10:00am ET) at market price. No stop loss. Position sizing: 2% risk per trade.
What the AI structural analysis identified:
Structural flaw: the absence of a stop loss was the most immediate issue. Without a defined stop, the maximum loss on any trade is unbounded. The position sizing description – "2% risk per trade, but without a stop" – is internally inconsistent. Position sizing to a defined risk percentage requires a stop to calculate the dollar risk. Without one, there is no mechanism to make the 2% rule functional.
Curve-fitting risk: the 3% gap threshold and 2x volume threshold were flagged as parameters specific enough to have potentially been calibrated around recent observed data. Is there an economic reason why 3% rather than 2% or 4% is the meaningful threshold? If not, the threshold may not hold out-of-sample.
Survivorship bias: the S&P 500 universe as it exists today includes only companies that survived and remained index constituents. Testing against this universe would exclude stocks that gapped up, reversed catastrophically, and were subsequently delisted – precisely the worst outcomes the strategy might have faced.
Market condition dependency: earnings gap strategies that work in trending markets frequently produce mean-reversion in choppy markets. In a risk-off environment, early pre-market buyers use the open liquidity to exit – the gap creates a selling opportunity rather than a continuation setup. The broader market condition at the time of entry is likely the most important variable the strategy is not currently including.
Execution assumption: the market open in a stock with elevated earnings volatility is the single most illiquid moment of the session. Bid-ask spreads are widest, price discovery is most uncertain, and the open price can differ dramatically from the last pre-market trade. Slippage at the open could consume a significant fraction of the expected move.
Single most likely fatal flaw: the combination of no stop loss and open-price entry in a volatile earnings stock. A 3% pre-market gap can become a 15% gap by 9:30am on additional news. Entering at the open with no stop exposes the position to the full reversal risk from whatever inflated open price the market discovers.
Three design changes that emerged before quantitative testing:
- Stop loss added at 2% below entry – making position sizing calculable and loss bounded
- Broader market filter added – SPY above its 5-day moving average at entry as a proxy for risk-on conditions
- Entry delayed by 5 minutes – avoiding the worst execution conditions of the opening auction
With those changes incorporated, the revised structural analysis confirmed the most significant design flaws had been addressed. The strategy then moved to TradingView for quantitative validation – which is where the statistical work properly belongs.
Strategy logic testing often surfaces risk management problems missing stop rules, position sizing assumptions that don't hold in volatile conditions. How to Build a Risk Management Framework with AI covers how to address those gaps structurally before the strategy goes live.
Frequently Asked Questions
Q: Can AI replace quantitative backtesting software like TradingView?
No. AI logic testing ensures your strategy's rules are internally sound, logically consistent, and structurally motivated before you invest time in coding and quantitative testing. TradingView and dedicated backtesting platforms calculate the statistical outcomes – win rate, maximum drawdown, Sharpe ratio – across years of actual historical data. Use AI to validate the idea first, then use software to prove the math. Neither substitutes for the other.
Q: What is the most common mistake when describing a strategy to AI?
Using judgment-based rules instead of binary rules. Telling an AI "the stock looks strong" is analytically useless – it can't evaluate a subjective assessment. Telling it "the stock must be up 3% on 2x the 20-day average volume with RSI above 60" gives the model precise, binary criteria against which to run a meaningful structural analysis. The more precisely you define the rules, the more specifically the model can identify where they break down.
Q: How do I know if my strategy is curve-fitted?
If your strategy requires very specific, arbitrary parameters – an RSI of exactly 63 or a gap of precisely 3.2% – to produce positive outcomes, you are likely curve-fitting to historical data. A robust strategy is built around durable market dynamics – volatility expansions, mean reversion to significant moving averages, institutional order flow patterns – that remain effective even when exact parameters are adjusted slightly. If changing the entry threshold from 3% to 3.5% eliminates the strategy's edge entirely, the edge may not be real.