
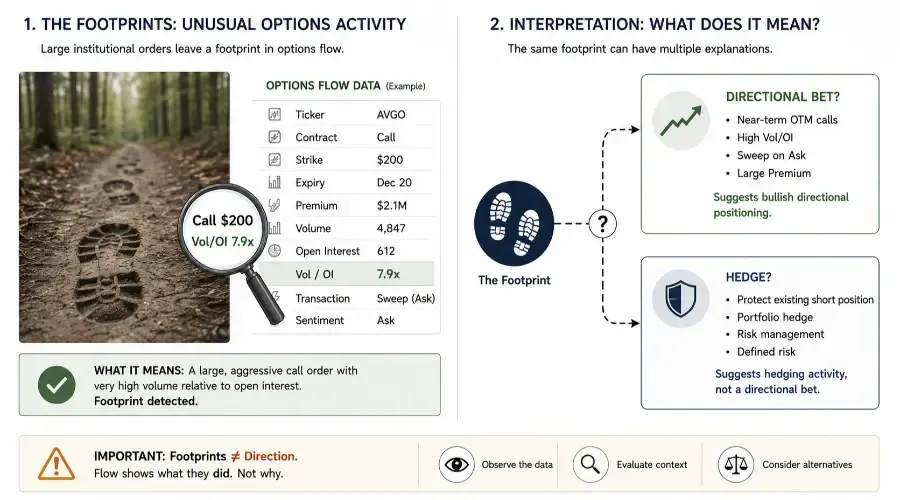
Institutional traders don't announce their intentions. But they do leave footprints.
The options market is where those footprints are most visible. When a large institution wants to establish a significant position – before an earnings report, ahead of a product announcement, or in anticipation of a catalyst – they often express that view through options. Options provide leverage, defined risk, and the ability to position for a specific timeframe at a fraction of the capital required for an equivalent equity position. They also create a data trail that anyone with access to options flow data can observe in real time.
Unusual options activity monitoring is watching those footprints, assessing what they suggest, and deciding whether the pattern represents genuine institutional conviction or routine hedging. AI structures that assessment efficiently.
Options flow data is a supplementary signal layer in the Fundamental Research with AI process. It covers the full hub overview and where flow analysis sits in the research sequence.
What Unusual Options Activity Is
Normal options flow is background noise – retail traders buying speculative positions, portfolio managers buying puts as insurance, market makers adjusting hedges. Unusual options activity is what happens when those patterns are disrupted: a contract that typically trades a few hundred contracts per day suddenly sees tens of thousands change hands; a strike price that no retail trader would consider attracts a concentrated burst of aggressive buying; a single transaction involving millions of dollars in premium hits the tape through a single broker.
These transactions appear in options flow data because the options market is a public exchange. Every transaction is reported. Dedicated options flow platforms aggregate that data, flag transactions that deviate from normal patterns, and present them in a filterable format.
Where to Find Options Flow Data
Unusual Whales is the most comprehensive retail-accessible platform – real-time flow, pattern flagging, filterable by ticker, premium size, contract type, and expiry. A subscription is required for full access.
Market Chameleon provides flow data alongside implied volatility analytics. The IV context matters: unusual activity in a low-IV environment reads differently from the same activity in an already-elevated IV environment ahead of a known catalyst.
Barchart unusual options is a free starting point – a straightforward scanner identifying contracts where volume significantly exceeds historical norms.
What Data to Paste Into AI
For each unusual transaction, paste these fields:
Ticker – the underlying stock or ETF
Contract type – call or put
Strike price – and its relationship to the current stock price (in-the-money, at-the-money, or out-of-the-money)
Expiry date – near-term under 30 days suggests directional intent; LEAPS suggest hedging or long-term positioning
Premium paid – total dollar value of the transaction
Volume – contracts traded in the session
Open interest – outstanding contracts before the session; volume relative to OI is the primary unusual activity signal
Transaction type – sweep (aggressive, multi-exchange execution prioritising speed) or block (large single transaction, often negotiated off-exchange and executed at mid-point). Sweeps signal urgency; blocks signal size without the same urgency indicator
Sentiment – ask-side execution on calls is the most bullish presentation
A note on multi-leg strategies: many institutions use spreads – buying a call at a lower strike while selling a call at a higher strike to reduce cost. A flow scanner may show two unusual transactions that partially cancel each other's directional signal. Always check for related contracts across strikes and expiries before interpreting a single leg as a standalone directional bet.
| Ticker | Type | Strike | Expiry | Premium | Volume | Open Interest | Vol/OI | Transaction | Sentiment |
|---|---|---|---|---|---|---|---|---|---|
| AVGO | Call | $200 | Dec 20 | $2.1M | 4,847 | 612 | 7.9x | Sweep | Ask |
| AVGO | Call | $195 | Dec 20 | $1.4M | 3,201 | 891 | 3.6x | Sweep | Ask |
| AVGO | Call | $210 | Dec 20 | $890K | 2,104 | 348 | 6.0x | Sweep | Ask |
The Signal Hierarchy
Not all unusual options activity carries the same weight. Four characteristics distinguish high-conviction directional signals from ambiguous or routine activity:
Volume-to-open-interest ratio above 3x – indicates substantial new positioning rather than rotation of existing contracts. At 5x, 8x, or higher, the signal strengthens. One important caveat: when open interest is very low – under 100 contracts – treat the 3x threshold cautiously. A single retail trade on a thinly traded contract can produce a 10x ratio that means nothing. Apply the 3x rule only when absolute volume also exceeds 500 contracts.
Premium threshold scaled to market cap – a single sweep generating significant premium is typically institutional in origin, but the threshold scales with the company's size. For mega-caps above $200B market cap, consider $5M+ as the institutional threshold. For large-caps between $10B and $200B, $2–3M+. For mid-caps, $1M+. Using a flat $1M threshold across all market caps overstates the unusualness of activity in large-cap names where that volume is routine.
Near-term expiry with out-of-the-money strikes – buying OTM calls expiring in under 30 days is the structure most clearly consistent with directional speculation rather than hedging. A hedger typically buys longer-dated puts near the current stock price – protection over time, not a short-duration leveraged bet.
Near-term out-of-the-money call sweeps are most commonly associated with pre-earnings positioning. How to Analyze Earnings Reports with AI covers the analytical process that should follow when unusual options activity points toward an upcoming earnings catalyst.
Sweep execution on the ask – sweep execution indicates urgency, prioritising fill certainty over price. Combined with ask-side execution, it signals a buyer who wanted the position established immediately.
When all four align – high Vol/OI ratio on 500+ contracts, above-threshold premium for the market cap, near-term OTM positioning, sweep execution on ask – the probability that the activity represents genuine institutional directional positioning is highest.
The Prompt
Act as an options flow analyst interpreting unusual options activity in [ticker].
Current stock price: $[price]. Data source: [platform], [date].

Options flow data: [paste table]

Based only on the data I've provided:

(1) Assess the Vol/OI ratio for each transaction – does it clear 3x on
contracts with absolute volume above 500? What does the magnitude suggest
about new positioning relative to prior interest?

(2) Assess the expiry and strike relationship – are these near-term OTM
contracts consistent with directional positioning, or do the characteristics
suggest hedging?

(3) Assess the premium size relative to the company's market cap using the
appropriate threshold ($1M+ mid-cap, $2-3M+ large-cap, $5M+ mega-cap).
Does sweep execution suggest urgency?

(4) Check for potential multi-leg strategy: are there related transactions
at different strikes or expiries that might offset the directional signal
of any single leg?

(5) State the overall signal assessment – high-conviction directional
positioning or routine hedging? Identify the specific factors driving
the assessment.

(6) State the alternative interpretation – what explanation fits the same
data without implying directional conviction?

Base the assessment only on the data provided. Do not introduce external
information about the company or upcoming catalysts.
Format using Markdown headers. Bold key findings.
End with: **Signal Assessment: [HIGH CONVICTION / MODERATE / NOISE]
due to [Primary Factor].**
What Options Flow Is Not
The most important caveat before applying any signal: large put buying – the first instinct in directional flow interpretation – is extremely commonly hedging rather than a bearish bet. An institution holding a large long equity position buys puts as insurance, generating the same flow signature as a bearish directional bet. Without knowing the institution's existing book, put buying cannot be reliably characterised as bearish positioning.
Even call buying can be hedging. A short seller buys calls to cap upside risk on their short. A market maker sells calls to a client and buys calls elsewhere to hedge. Both generate call-buying flow identical to bullish directional positioning.
Options flow tells you that a large participant committed significant capital to a specific position. It does not tell you what the rest of their book looks like.
Broadcom Q4 2024 – Walkthrough
Broadcom was approximately two weeks from its Q4 2024 earnings report. Unusual call activity in AVGO appeared in flow data the week of November 25, 2024, with the stock at approximately $173.
All three transactions cleared the 3x Vol/OI threshold on absolute volumes well above 500 contracts – the $200 strike at 7.9x, $210 at 6.0x, $195 at 3.6x. All three were December 20 expiry – placing the contracts squarely within the two-week pre-earnings window. Strikes of $195 to $210 against a $173 stock price put all three contracts 13% to 21% out of the money. Total premium across the three sweeps exceeded $4.4 million. Broadcom's market cap at the time was approximately $800B – a mega-cap where the $5M+ institutional threshold applies. The $2.1M largest sweep is below that threshold individually, but the $4.4M aggregate across tightly clustered contracts in the same expiry raises the signal quality. All executed as sweeps on the ask.
The model's alternative interpretation was precise: the most plausible non-bullish explanation is call buying as a hedge against a significant existing short position. Near-term OTM calls cap potential loss on a short if earnings produce a large upside surprise. That hedging motive generates identical flow to the bullish directional interpretation – indistinguishable from the flow data alone.
Overall Signal Assessment: HIGH CONVICTION directional positioning due to Vol/OI ratios significantly above threshold, near-term OTM structure, sweep execution across all three legs, and tightly clustered strike selection consistent with a single participant's positioning.
How this translates to a trade decision: options flow is a conviction modifier, not a standalone trigger. A trader already constructive on AVGO fundamentals – strong AI chip revenue, VMware integration tracking, estimate revisions trending positive – might use this flow confirmation to increase position size from 2% to 3% of portfolio, or to widen a stop loss to give the trade more room ahead of the catalyst. A trader with no prior AVGO thesis should use this as a research starting point, not a trade entry.
Unusual options activity and insider transactions are both windows into what informed, committed capital is doing in a specific stock. How to Use AI to Read Insider Transaction Data covers the Form 4 signal hierarchy and how to interpret it alongside options flow for a more complete institutional picture.
Building Options Flow Into the Workflow
Unusual options activity monitoring works best as a supplementary screening tool – identifying which names on your watchlist are attracting institutional attention, then applying the full fundamental and technical research process to those names.
For companies in the two weeks before a scheduled earnings release, a daily scan takes 5 to 10 minutes on any of the platforms described above. If significant unusual activity appears in a name you're already monitoring, the AI interpretation process here provides a structured assessment of whether the activity is worth incorporating into your thesis.
Options flow and insider transactions are the two data sources providing the clearest windows into what informed, committed capital is doing in a specific stock. Neither is a reliable standalone signal. Both are meaningful additions to a complete research process that begins with fundamentals and uses these supplementary signals to assess the conviction of other market participants.