
Breakout Bulletin | March 27, 2026 | Analysis by the BreakoutBulletin Editorial Team
Alphabet shares fell 3.28% in a single session, significantly underperforming the S&P 500’s 0.37% decline.
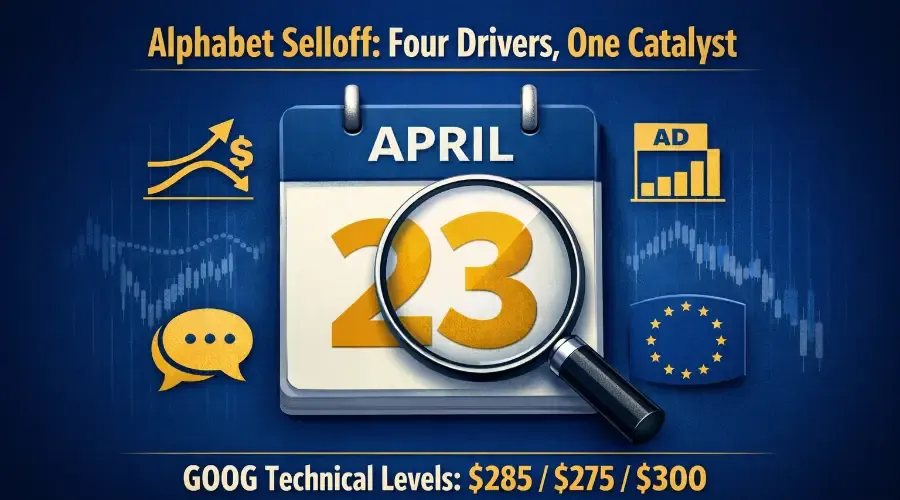
This underperformance is not random-it reflects a convergence of four distinct pressures acting on the stock simultaneously.
In practical terms, the selloff is driven by a mix of macro forces, competitive narratives, capital allocation concerns, and regulatory uncertainty.
The Selloff - What the Data Shows
Alphabet’s move stands out when compared to broader market performance.
While the S&P 500 declined modestly, Alphabet fell significantly more, with GOOGL dropping even further than GOOG on the same session.
The spread of roughly 3 percentage points versus the index is meaningful. It indicates stock-specific selling pressure rather than general market weakness.
A key data point is the divergence with Nvidia. NVDA rose 1.2% on the same day Alphabet declined, highlighting a market distinction between AI hardware beneficiaries and AI platform risk.
This divergence suggests that investors are rewarding visible AI demand (hardware) while questioning monetisation pathways for AI platforms like Alphabet.
The Four Drivers - Why Alphabet Is Underperforming
Driver 1 — Treasury Yield Pressure
Rising Treasury yields directly impact growth stock valuations.
The 10-year yield moving from 4.40% to 4.45% increases discount rates, leading to multiple compression.
Alphabet’s forward P/E of ~25.7x remains above the sector average, making it sensitive to rate movements.
While yield movement alone does not explain the full decline, it creates the environment where negative narratives amplify selling.
Driver 2 — AI Advertising Competition Narrative
Meta and Amazon are increasing AI-driven advertising capabilities, creating concerns around Google’s core ad dominance.
This is currently a narrative, not a confirmed revenue trend, as Alphabet still projects ~14% ad growth in 2026.
Markets, however, price narrative risk ahead of data confirmation.
Driver 3 — Search Disruption Risk
AI-native platforms like ChatGPT and Perplexity are gaining mindshare in discovery queries.
The key uncertainty is whether mindshare loss translates into revenue loss.
Google’s AI Overview integration is designed to defend this position, but it introduces a structural question:
If users get answers without clicking ads, can the CPC model sustain its economics?
Driver 4 — Regulatory Overhang
EU Digital Markets Act enforcement creates ongoing uncertainty.
Potential outcomes range from manageable fines to structural remedies, including changes to default search positioning.
The uncertainty itself limits multiple expansion, even if worst-case outcomes do not materialise.
The Fundamentals - What the Numbers Actually Show
Alphabet’s financials reveal a nuanced picture.
Revenue remains strong, with ~$91.69B and ~19.8% growth, indicating that core businesses are still expanding.
However, EPS declined ~1.78% year-over-year, suggesting cost growth is outpacing revenue.
The most critical factor is capital expenditure. Alphabet guided $175–185B in 2026 capex versus ~$120B expected, creating a $60B gap.
This gap is the central concern. If capex doubles while revenue grows in the mid-teens, operating margins compress, which the market is beginning to price in.
In practical terms, the debate is not about survival—it is about margin trajectory.
Bull vs Bear - The Structural Arguments
Bull Case
Alphabet’s AI ecosystem—Gemini, TPUs, and Google Cloud—creates a powerful competitive moat.
$100B+ free cash flow provides the ability to fund capex while maintaining buybacks.
Relative valuation (~25x forward P/E) remains lower than most Mega-Cap peers.
Bear Case
The $60B capex gap introduces unprecedented margin pressure.
Search disruption risk from AI-native platforms remains unresolved.
Regulatory overhang from EU DMA adds structural uncertainty.
In practical terms, the bull case is built on long-term dominance, while the bear case is focused on near-term margin compression and narrative risk.
Key Technical Levels and Sentiment Signals
Market participants are closely watching three key levels.
~$285 (50-day moving average) acts as near-term support. A hold suggests stabilisation, while a break increases downside risk.
~$275 (200-day moving average) represents a structural trendline. Sustained breaks below this level historically indicate deeper trend shifts.
~$300 (resistance) is the key recovery level. Reclaiming it would invalidate the current bearish narrative.
Sentiment indicators show elevated caution, with RSI near 42 and put/call ratio at 1.8:1, indicating increased hedging activity.
The Catalyst Timeline - What Resolves the Debate
March 28 — PCE Inflation: A higher reading could push yields up further, increasing pressure on growth multiples.
April 23 — Q1 Earnings: The most critical event. Focus areas include search revenue, cloud growth, and margin trends.
April 23 — Capex Guidance Update: Any change to the $175–185B range will directly impact sentiment.
May 2026 — Hyperscaler Capex Season: Peer guidance from Microsoft, Amazon, and Meta will influence AI investment expectations.
June 2026 — EU Antitrust Ruling: Regulatory outcomes could shift long-term valuation assumptions.
In practical terms, April 23 earnings will be the first real test of whether the current selloff reflects overreaction or early repricing.
Structural Takeaway
Alphabet is facing a rare convergence of four independent pressures—yields, AI competition, search disruption, and regulation.
The selloff is not irrational, but it may be front-loading risks that are not yet visible in financial data.
The key question is whether fundamentals will confirm the narrative—or invalidate it.
FAQ
Why is Alphabet (GOOG) falling?
The decline is driven by a combination of yield pressure, AI competition concerns, search disruption risk, and regulatory uncertainty. These factors together create stronger selling pressure than any single driver alone.
Does AI competition threaten Google’s revenue?
Not yet in reported data. However, the risk lies in future behaviour—if user queries shift to AI platforms, ad monetisation could face structural pressure.
Is Alphabet cheap at ~25x forward P/E?
Relatively yes versus Mega-Cap peers, but still a premium to the sector average. The valuation depends on whether growth and margins justify that premium.
What levels should investors watch?
~$285 (support), ~$275 (trendline), and ~$300 (resistance) are the key levels currently guiding market behaviour.
Disclaimer
This article is for informational and educational purposes only and does not constitute financial, investment, or trading advice. You are solely responsible for your own investment decisions and should consult a licensed financial professional before acting on any information in this post.