
If you have ever wondered whether AI technical analysis can read your stock charts for you, or how to use AI for stock chart analysis with tools like ChatGPT, you have likely encountered a major disconnect between expectation and reality.
There is a version of AI-assisted charting that most retail traders imagine: you take a quick screenshot of your chart, upload it into an LLM, and expect the model to instantly draw precise support lines, call out subtle candlestick patterns, and tell you whether to buy or sell.
In the real world of professional market execution, that approach is a shortcut to losing capital.
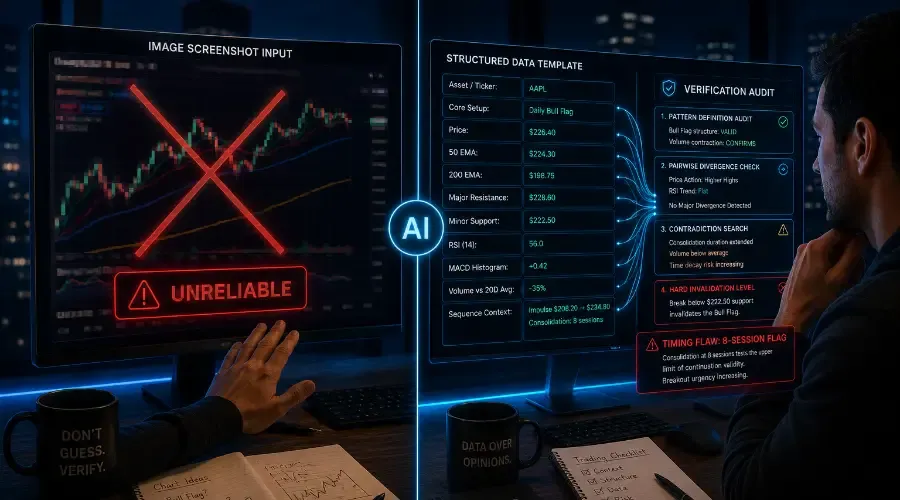
While modern multimodal AI models can recognize macro geometry and broad shapes, they lack absolute precision at the pixel level. A compressed image cannot reliably communicate whether a candlestick wick pierced a key liquidity level by a few cents, nor can it track the exact mathematical rate of change inside an indicator histogram.
The true leverage point of AI chart analysis does not lie in processing images–it lies in parsing structured technical data. When you feed an LLM numerical matrices and objective descriptions, it transforms into an institutional-grade validation engine. It acts as a cynical second opinion, actively hunting for logical flaws in your trading setup and short-circuiting your confirmation bias before you risk a single dollar.
This hub is part of the How to Use AI for US Stock Market Trading series. The pillar post gives you the complete series map and reading order if you're coming in fresh.
The Non-Negotiable Rule: Garbage In, Garbage Out
Before deploying an LLM into your charting routine, you must accept one operational truth: AI validates the internal logic of the setup you describe.
If you misidentify a major resistance level or hallucinate a continuation pattern that isn’t actually there, the AI’s output will be logically consistent with your error. The model cannot see the live tape independently; it relies entirely on the premise you provide. The accuracy of your foundational chart reading remains completely non-negotiable. AI does not replace your eyes–it audits your judgment.
The Execution Workflow
To successfully run a precise technical verification pass without falling victim to visual errors, follow this structured, step-by-step process.
1. Formulate Your Core Trading Thesis:
Identify a potential trade setup on your charting platform. Clearly define your directional bias (Long or Short), your target execution level, and your initial profit target based on your standard charting rules.
2. Extract Structured Technical Data:
Instead of relying on image uploads, extract the exact numerical coordinates of your setup. Gather your current price relationship to key moving averages, absolute indicator levels, and volume metrics.
3. Enforce Explicit Pairwise Cross-References:
Do not expect the AI to automatically catch subtle discrepancies. You must explicitly instruct the model to perform pairwise audits between specific data points, such as comparing the raw price trend directly against momentum indicator slopes to isolate hidden divergences.
4. Execute the Multi-Timeframe Check:
Input your localized setup data alongside macro timeframe trends. Ensure your execution timeframe does not directly contradict the higher-timeframe market structure before placing an order.
Structured Text vs. Image Screenshots
| Analysis Vector | Visual Screenshot Uploads | Structured Text & Numeric Data |
|---|---|---|
| Precision Depth | Low. Prone to rendering distortions and spatial hallucinations. | High. Tracks exact decimal coordinates for price, volume, and indicators. |
| Divergence Detection | Unreliable. LLMs easily miss subtle indicator-to-price drift visually. | High. Mathematical tracking catches micro-divergences instantly. |
| Friction Level | Low initial effort, but high rate of downstream analytical errors. | Moderate initial setup, but highly scalable via templates. |
| Primary Use Case | Initial macro tracking (e.g., broad horizontal channels). | Tactical execution checks and strict risk management. |
Overcoming the Friction Bottleneck: The Data Template
Writing down structural data manually for every stock chart creates massive operational friction. Most AI for stock traders workflows fail because typing out numbers becomes a tedious bottleneck.
To solve this, you can use your phone’s voice-to-text feature to dictate these values in seconds while looking at your screen, or use the “Export Chart Data” CSV feature native to platforms like TradingView. When exporting a CSV, grab only the Date, Open, High, Low, Close, and Volume columns for the relevant lookback period–pasting the entire raw file into the prompt dilutes the AI’s focus. The voice method is often faster for a quick single-chart audit.
The Plug-and-Play Input Blueprint
Copy this mini-template into your trading journal or notes app. Fill it in rapidly before pasting it into your chosen AI engine:
text
- Asset / Ticker: [Ticker Here]
- Core Setup: [e.g., Daily Bull Flag / 1-Hour Support Bounce]
- Price vs. 50 & 200 EMAs: [Price is at $X, 50 EMA is at $Y, 200 EMA is at $Z]
- Major Horizontal Levels: [Resistance at $A, Support at $B]
- Momentum Stats: [RSI is at X and falling/rising. MACD histogram is X]
- Volume Profile: [Volume is X% above/below the 20-day average]
- (Optional) Sequence Context: [e.g., Price made 3 higher highs while RSI made 3 lower highs]
The sequence context line is optional but powerful–it gives the AI the specific swing-by-swing data needed to spot hidden divergences a single snapshot might miss.
The foundational skill for technical analysis with AI is knowing what data to provide and how to format it. What to Paste into AI for Chart Analysis covers the four input types that work - OHLCV tables, indicator readings, text descriptions, key level lists with a complete template you can use immediately.
The Technical Verification Master Prompt
When you are ready to audit a trade setup, paste your completed data blueprint into your LLM along with this precise, active-auditor prompt string. The output will feel blunt–it’s designed to challenge your thesis, not comfort you. That bluntness is exactly the point.
text
Act as a professional risk manager and quantitative chart technician. I am going to provide a textual data package outlining a potential technical trade setup I have identified.
Your job is to act as a highly cynical auditor. You must stress-test my chart thesis, isolate structural contradictions, and define hard risk invalidation parameters.
Technical Data Blueprint:
[PASTE YOUR COMPLETED MINI-TEMPLATE HERE]
Execute the following four tasks based strictly on these metrics:
(1) PATTERN DEFINITION AUDIT: Evaluate the dimensions of the described setup. Are the proportions (e.g., duration of consolidation vs. length of the prior impulse leg, volume decay rates) entirely consistent with the formal technical definition of this pattern?
(2) PAIRWISE DIVERGENCE CHECK: Explicitly cross-reference price action against momentum indicators. Check if the price trend and the RSI/MACD trends are sending conflicting signals (such as price making higher highs while RSI makes lower highs). Report any hidden divergences. How to Use AI to Interpret RSI, MACD, and Momentum Indicators goes deeper on the contextual framing that makes indicator readings meaningful—how to describe trend, timeframe, and sector context alongside a reading, and how to ask AI to reconcile conflicting signals.
(3) CONTRADICTION SEARCH: Isolate every variable in the data that actively weakens, complicates, or contradicts my thesis. Focus intensely on volume deficiencies or extended consolidation timelines.
(4) HARD INVALIDATION LEVEL: Define the exact price coordinate or structural event that mathematically invalidates this technical setup, explaining the structural logic behind that boundary.
Keep your tone analytical and direct. Do not provide generic trading advice or vague directional predictions.
A quick note on when to skip this audit: if the market is stuck in a wide, directionless range and no clear technical pattern has formed, forcing the AI through this deep verification will only generate noise. The master prompt is built for discrete, identifiable setups–not ambient chop.
Real-World Case Study: The AAPL Continuation Pass
Let’s look at how this active-auditor framework changes the analysis of an apparent daily continuation setup on Apple (AAPL).
A trader identified what looked like a classic daily Bull Flag. They inputted the following structured data: Price at $226.40, resting above a rising 50-day EMA ($224.30). A sharp vertical flagpole impulse moved from $208.20 to $234.80. The subsequent consolidation channel drifted between minor support at $222.50 and resistance at $228.60 over 8 sessions. Volume declined steadily by 35% relative to its 20-day average. Daily RSI rested at 56.
The AI Diagnostic Breakthrough
Because the prompt forced a structural audit rather than a passive summary, the AI output caught a critical timing flaw that a simple visual glance would likely minimize:
“STRUCTURAL TIMING WARNING: While your volume contraction and EMA structural positioning perfectly validate basic bull flag logic, your trend duration data shows the consolidation phase has persisted for 8 full sessions. For an aggressive momentum pattern, an 8-day pause tests the outer boundary of continuation validity. The longer price remains pinned within this tight range without a breakout impulse, the higher the mathematical probability that institutional buying energy is dissipating, turning a valid flag into a flat distribution range.”
Volume and breadth are the confirmation layer that tells you whether a price move has real participation behind it. How to Analyze Volume and Market Breadth Data with AI covers relative volume, the advance-decline line, breadth thresholds, and how AI interprets all of them together.
Multi-Timeframe Note: For a comprehensive verification, you should always cross-reference these findings across multiple timeframes. This specific example focuses purely on the daily setup, but validating the macro weekly trend and micro intraday entry triggers (as detailed in Blog 19) adds an essential layer of safety.
Technical analysis doesn't run in isolation, it sits inside a daily research workflow that covers pre-market context, sector alignment, and post-session review. Daily Trading Workflow with AI covers the full system and shows how technical setup analysis connects to the other stages.
Technical AI Workflows: Frequently Asked Questions
Can AI read my live TradingView or ThinkOrSwim charts directly?
No. Standard consumer LLMs cannot log into your private brokerage accounts or monitor live, flashing browser tabs in real time. They operate on historical data, static text inputs, or point-in-time data extractions. To get real value out of an AI workflow, you must act as the primary data gatherer, feeding the model clean text metrics exported or observed from your charting platform.
Which AI tool is best for performing technical analysis reviews?
For text-based, highly analytical data synthesis and pattern auditing, models with strong reasoning engines–such as Anthropic’s Claude 3.5 Sonnet or OpenAI’s ChatGPT (using the latest reasoning configurations)–perform exceptionally well. They follow complex, multi-step instructions without losing track of your data constraints.
Does this text-based AI workflow apply to crypto and forex charts too?
Yes, absolutely. Technical analysis structures–such as support and resistance matrices, volume profiles, and momentum indicators–rely on the exact same mathematical logic across all liquid asset classes. Whether you are analyzing Bitcoin, EUR/USD, or blue-chip stocks, the data formatting principles and the Master Prompt structure remain identical.