
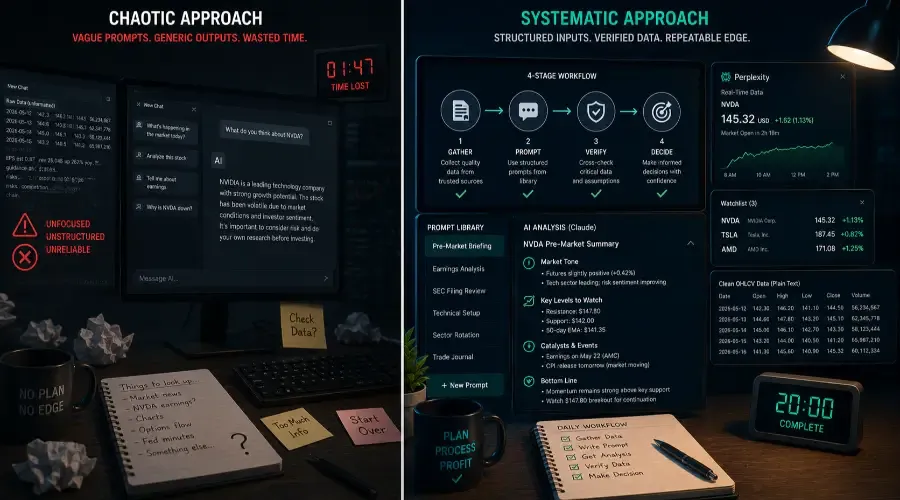
Every trader who integrates artificial intelligence consistently eventually arrives at the same realization: ad-hoc AI use feels useful in the moment but compounds poorly over time.
You write a prompt, get a helpful summary, and move on. Tomorrow, you write a slightly different prompt for the exact same research task, receive a completely different layout, and nothing you learned yesterday carries forward.
An optimized workflow fixes that. It turns isolated AI interactions into a repeatable, systematic process–one where each session builds on the last, where your prompt templates get sharper through iteration, and where the time you spend on research compounds into a genuine trading edge rather than just empty desk activity.
This post provides a complete starting framework: your primary tool stack, precise time allocation, common workflow mistakes to avoid, and a real-world pre-market routine walked through from start to finish.
If you haven't covered the tool basics yet, Getting Started with AI for Stock Trading is the right starting point – it covers the three main tools, free vs paid tiers, and the input-output model that makes workflow design make sense.
The Four-Stage AI Trading Workflow
Every effective AI-assisted trading workflow–regardless of your specific strategy, indicators, or holding period–moves through the same four structural stages. The specific data points change; the sequence never does.
Stage 1: Gather Data (Human-Driven)
Before you even open an AI interface, you must collect your raw source material: price tables, earnings releases, economic calendars, breaking headlines, or sector ETF metrics. You pull this information from primary, uncompromised sources and format it for clean entry.
This stage is entirely human. Base AI models cannot do this for you because the data required is live, dynamic, and specific to the current market micro-structure. What you gather in Stage 1 dictates the absolute ceiling of your output quality.
Time Allocation: 5 to 10 minutes for a standard daily pre-market session.
Stage 2: Prompt AI (Tool-Driven)
With your raw data gathered and structured, you enter your AI workstation. You execute your structured prompt template–assigning a role, calibrating the context, pasting the clean dataset, defining specific tasks, and locking down rigid scope constraints.
You use iterative, layered follow-up questions to drill into what the initial extraction surfaces.
Time Allocation: 10 to 15 minutes. Over time, your prompt library compresses this step significantly.
Stage 3: Verify Output (The Critical Firewall)
Before any AI-generated insight informs a live trade, you verify the specific numbers. Any calculation, margin percentage, or historical price level the model references–whether pulled from your pasted text or surfaced from its internal weights–must be cross-checked against your primary sources.
This step is non-negotiable. It is a fixed, mandatory cost of responsible AI usage.
Time Allocation: 3 to 5 minutes. This step separates systematic research from blind faith.
Stage 4: Make the Decision (Human Judgment)
The data is verified, and the structural analysis is laid out in front of you. Now, you apply your personal human judgment–your strict strategy rules, your specific risk parameters, your account capital sizing, and your intuitive read of live liquidity conditions.
AI informs the research. The decision is yours alone. The tool's participation ends entirely at Stage 3.
Tool Stack: Matching the Tool to the Task
An efficient workflow does not rely on a single generalist model for everything. Different models feature radically different underlying architectures. Matching the correct tool to its specialized task produces consistently cleaner execution.
Perplexity: Your Real-Time Market Scout
Use Perplexity exclusively at the start of your research session for anything time-sensitive: overnight global futures positioning, pre-market gap-up movers, macroeconomic data drops, breaking news, and current consensus analyst estimates. Perplexity’s strengths lie in real-time information retrieval and broad news synthesis.
Warning: Do not rely on Perplexity for deep, heavy analytical work on long documents or nuanced data tables. Furthermore, its live search can occasionally pull from low-quality financial blogs; always scan its cited links during your verification phase.
Claude: Your Advanced Analytical Core
Once you have retrieved your raw macro data, Claude is where the deep analytical research happens. Use it for parsing corporate earnings transcripts, extracting SEC filing anomalies, cross-referencing multi-factor technical indicator groups, and analyzing sector rotation patterns.
Claude handles massive text blocks seamlessly, and its reasoning engine handles complex, multi-layered constraints with the highest degree of nuance available in consumer LLMs.
ChatGPT: The Capable Workflow Generalist
ChatGPT serves as an ideal bridge between the two extremes. It excels at general research queries, drafting structured post-market trade journals, exploring economic concepts, or running automated tasks via custom Python data tools in parallel while your primary tabs are active.
Building a Basic Prompt Library from Day One
A prompt library is a centralized repository of reusable templates–inputs you have structured once, refined through live testing, and can deploy instantly every time you run a recurring analysis.
The reason to start building this library immediately is compounding efficiency. A template you use today gets modified the next time a model misinterprets a data point. By its twentieth iteration, it yields outputs that are orders of magnitude cleaner than your first draft.
Your library should systematically grow to cover these core categories:
Pre-Market Macro Briefing
Corporate Earnings Report Analysis
SEC Filing Risk Factor Review
Tabular Technical Setup Assessment
Sector Relative Strength Performance Ranking
Post-Market Trade Journaling
Where to Store Your Library
Notion or Obsidian
Ideal for creating an organized, searchable, tag-based template database.
Claude Projects
A powerful native feature that allows you to embed your custom prompt templates directly into a persistent AI workspace. It acts as an isolated sandbox that retains your unique trading style, risk profile, and market context across weeks of daily conversations, saving you from re-pasting background details every morning.
Starting the library on day one matters more than starting it perfectly. How to Build a Reusable Prompt Library for Trading covers the eight categories, the variable field structure, where to store it, and the three-use refinement rule that makes it genuinely compound over time.
Three Common Setup Mistakes to Avoid
Over-Complicating the Tool Stack
Beginners often try to run five different AI models simultaneously alongside complex data automation scripts. This creates massive operational friction, leading to workflow abandonment within a week.
Start simple: Master Perplexity for sourcing and Claude for analysis before adding a third variable.
Skipping the Prompt Library
Writing your prompts from scratch every morning feels harmless initially, but it becomes a major bottleneck when volatility spikes. On high-volume days when market context is shifting rapidly, you will not have the time or focus to type out an intricate, hallucination-free prompt from scratch.
Treating AI Output as Execution Truth
The massive speed gains offered by AI can easily lull you into a false sense of security, making verification feel like unnecessary drag. Skipping Stage 3 is exactly how a trader executes a position based on a miscalculated margin figure or a hallucinated support level.
The Daily Pre-Market Routine Walkthrough
Here is a practical, end-to-end pre-market routine engineered for a retail trader analyzing the US stock market. While this example uses specific Eastern Time (ET) coordinates for a trader preparing ahead of the 9:30 AM ET US opening bell, the core framework is completely universal–simply shift the timestamps to align with your local market pre-open session.
This is a Monday morning workflow during an active week–no major earnings, one significant macro event (CPI release Tuesday), and a few sector themes developing from the prior week.
8:00 AM ET – Sourcing the Macro Environment (Perplexity)
Open Perplexity and execute your live market query:
"Identify current US market overnight futures positioning for Monday [Date] and extract the top three global macro headlines impacting equity markets this morning."
Perplexity surfaces S&P 500, Nasdaq, and Dow futures metrics alongside core geopolitical or economic data. Copy the clean text output into a temporary scratchpad.
Elapsed Time: 4 minutes.
8:04 AM ET – Sector Rotation Mapping (Finviz / Yahoo Finance)
Open Finviz or your tracking sheet. Navigate to the ETF data module showing the 5-day performance vectors of the 11 major SPDR sector ETFs (e.g., XLK, XLY, XLE). Copy the raw table columns directly.
Elapsed Time: 2 minutes.
8:06 AM ET – Running the Analytical Engine (Claude)
Open Claude. Pull your Pre-Market Briefing Template from your library and paste it into the chat window. Ensure you swap out the bracketed placeholders with the actual text chunks you just copied from Perplexity and Finviz:
text
Act as an institutional market strategist preparing a pre-market overview for a swing trader focused on US technology and semiconductor equities with a 5-to-15 day holding period [ROLE & CONTEXT].
I have pasted two verified data blocks below: [PASTE YOUR RAW PERPLEXITY SUMMARY AND FINVIZ ETF TABLES HERE].
Execute these tasks [SPECIFIC TASK]:
- Synthesize the overnight futures data and characterize the opening tone.
- Analyze the sector ETF table and isolate the two sectors showing dominant momentum versus the two clearest distribution trends.
- Highlight any major structural event risk scheduled for this week (e.g., CPI, FOMC minutes) that directly intercepts the technology sector.
Constraints: Work strictly from the provided text chunks. Do not generate directional trade recommendations or specify entry prices. Keep your output locked to three clearly labeled, high-scannability bulleted summaries [CONSTRAINTS].
Run the prompt, process the output, and run a single follow-up query to drill down into the specific stocks showing outperformance within the leading sector.
Elapsed Time: 8 minutes.
8:14 AM ET – The Verification & Watchlist Lock
Quickly check the numbers mentioned in Claude's sector analysis against your raw Finviz table data to ensure zero translation errors (2 minutes).
Filter your platform's screener to the outperforming sector, sort by relative strength, and lock in your top 3 target candidates for the day's watch window (4 minutes).
Elapsed Time: 6 minutes.
8:20 AM ET – Routine Concluded
In exactly 20 minutes, you have successfully transformed chaotic global market information into a verified, structured, and actionable blueprint for the upcoming trading session. With over an hour to spare before the opening bell rings at 9:30 AM ET, you are fully prepared.
The Pre-Open Reality Check (The Gap Refresh)
Because this intensive routine runs at 8:00 AM ET, a dynamic 90-minute information gap exists before the actual 9:30 AM ET opening bell. To bridge this gap safely, execute a lightning-fast 2-minute checkpoint at 9:15 AM ET: Re-run your Perplexity futures query to check if late-breaking European closing volume or unexpected economic updates have fundamentally altered the morning's data baseline.
When you apply this same four-stage workflow to options trading setups, simply fold in implied volatility rank, open interest concentration, and unusual options flow as additional data layers during Stage 1. The gather-prompt-verify-decide structure remains identical, keeping your process consistent across asset classes.
This post gives you the skeleton. Daily Trading Workflow with AI builds it out in full – five stages, seven specific daily tasks, and a complete Tuesday workflow during an active earnings week showing how AI compresses 90 minutes into under 30.
Frequently Asked Questions (FAQ)
Q: Should I create separate Claude conversations for every stock I analyze?
A: Yes, absolutely. Keeping your research compartmentalized prevents cross-talk contamination. If you analyze Apple earnings inside the same chat window where you just evaluated Nvidia's technical layout, the model will inevitably start bleeding contextual references between the two companies, increasing hallucination rates.
Q: Can I completely automate Stage 1 and Stage 2 using API scripts?
A: While it is technically possible to program data pipelines that feed into AI APIs, manually copying and formatting your data chunks keeps you actively engaged with the numbers. Sourcing your own data builds a subconscious baseline awareness of market structures that full automation completely erases.
Q: How often should I audit and rewrite the templates in my prompt library?
A: A good rule of thumb is to audit your core templates once a month. If you notice a model consistently generating broad answers or ignoring a specific constraint across multiple sessions, open the template file and tighten the language, add explicit negative constraints, or restructure your data input labels.
Risk Disclaimer: AI models are language processing engines, not registered financial advisors. They lack authentic, live market intuition, cannot calculate real-time capital drawdowns, and are prone to logical and structural hallucinations. All AI-generated research outputs must be independently cross-checked and verified against primary market data before informing an active trading decision. Past workflow efficiency gains or historical optimization metrics do not guarantee future trading consistency or financial returns. Expose capital at your own risk.