
The most common watchlist-building mistake retail traders make is starting at the bottom of the data funnel.
They open a stock screener, filter for names with high volume or massive intraday momentum, generate a list of tickers, and jump straight into chart analysis. While the resulting list might look technically sound–the stocks are undeniably moving–it lacks structural context.
Without understanding why those stocks are moving, or whether that movement is driven by a durable institutional capital shift or a fleeting, retail-driven short squeeze, your watchlist is just a collection of random price action.
A watchlist built top-down–starting with the macro environment, identifying sector leadership, filtering for true market breadth, and selecting individual stocks only when the sector canvas is clear–is a fundamentally different weapon.
The names on a top-down list are selected because they have a structural wind at their back. They are aligned with institutional money flows, confirmed by technical relative strength, and insulated from blind sector concentration traps.
AI accelerates this entire pipeline, compressing what used to be a multi-hour data-sifting chore into a systematic 25-minute pre-market workflow.
Watchlist building is the output of the pre-market stage in the daily workflow. Daily Trading Workflow with AI covers how all five stages connect and where sector analysis fits in the sequence.
The Top-Down Institutional Filtering Funnel
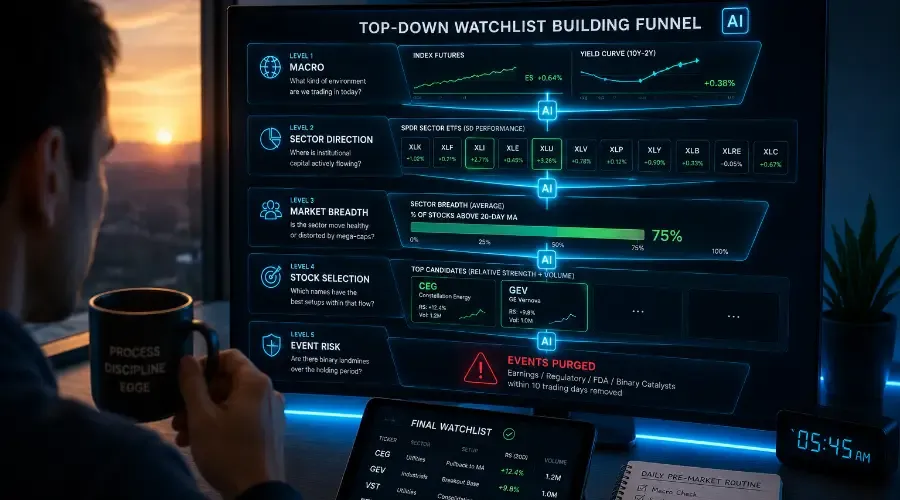
To build a high-probability trading list, your analysis must flow sequentially through five distinct filters. You do not skip a level. If a level fails to provide confirmation, the process stops.
| Analysis Level | Core Question to Answer | Primary Data Inputs | AI's Strategic Role |
|---|---|---|---|
| Level 1: Macro | What kind of environment are we trading in today? | Index futures, bond yields, macro economic calendar | Synthesizing broader risk-on vs. risk-off sentiment. |
| Level 2: Sector Direction | Where is institutional capital actively flowing? | 5-day and 20-day performance of the 11 SPDR Sector ETFs | Ranking sector momentum and identifying emerging rotations. |
| Level 3: Market Breadth | Is the sector move healthy or distorted by mega-caps? | Equal-weighted ETFs (RSPT, RSPH), % of stocks above 20-day MA | Detecting structural concentration or broad sector participation. |
| Level 4: Stock Selection | Which names have the best setups within that flow? | Volume-filtered screener data tracking relative strength | Multi-variable ranking of candidates based on technical "asset quality." |
| Level 5: Event Risk | Are there binary landmines over the holding period? | Corporate earnings calendar, FDA/regulatory timelines | Purging tickers with imminent corporate catalysts. |
Levels 1, 2, & 3: Isolating True Sector Currents
Individual stocks do not move in a vacuum. They move within sector currents driven by macroeconomic variables like interest rate trajectories, economic cycles, and currency shifts.
A technical breakout in a semiconductor stock during a period of broad technology sector accumulation has a high probability of structural follow-through. The exact same breakout attempted while the tech sector is experiencing institutional distribution is highly prone to failure.
To map these flows cleanly, copy the sector performance matrix from platforms like Finviz or your broker platform. Focus specifically on the 5-day (tactical momentum) and 20-day (medium-term trend) performance metrics for the 11 core SPDR Sector ETFs (e.g., XLK, XLF, XLE, XLU).
The macro and futures context from the pre-market briefing is the starting frame for sector analysis. If you haven't set up that briefing process yet, How to Build a Pre-Market Briefing with AI covers the full data sourcing and prompt structure.
The Mega-Cap Concentration Warning
Because standard sector ETFs are market-capitalization weighted, a massive move in an ETF can be a complete illusion. For example, a 5% weekly surge in Technology (XLK) can be driven entirely by aggressive buying in Apple and Microsoft, masking the fact that 80% of the software and semiconductor stocks within that sector are actually breaking down.
To prevent this distortion, implement a Breadth Check before running your sector analysis:
Cross-reference cap-weighted sector performance against equal-weighted counterparts (e.g., comparing XLK to RSPT, or XLF to RSPF).
Alternatively, look at a market breadth indicator, such as the percentage of sector stocks trading above their individual 20-day moving averages.
If the cap-weighted ETF is surging but fewer than 50% of its constituents are above their 20-day moving averages, the sector lacks broad institutional participation and should be treated with extreme caution.
Volume and breadth data add the confirmation layer to sector selection. How to Analyze Volume and Market Breadth Data with AI covers the specific metrics to paste and the prompt that interprets them alongside price action.
The Refined Sector Rotation AI Prompt
Run this prompt during your pre-market routine once you have compiled your daily sector performance and breadth metrics. Notice that the threshold check is intentionally framed as adaptive rather than rigid to account for varying market volatility regimes:
text
Act as a macro portfolio strategist conducting sector rotation analysis for an active swing trader with a 5-to-15 day holding period.
I have provided the 11 SPDR sector ETF performance matrix (showing 5-day and 20-day returns), market breadth metrics, and today's prevailing macro context.
Sector Performance Data: [PASTE PERFORMANCE MATRIX HERE]
Market Breadth Indicators: [PASTE EQUAL-WEIGHT VS CAP-WEIGHT DIFFERENTIALS OR % OF STOCKS ABOVE 20-DAY MA]
Current Macro Context: [PASTE MORNING MACRO BRIEFING / FUTURES / YIELDS HERE]
Based strictly on this data, execute the following four tasks:
(1) Rank the 11 sectors from strongest to weakest based on combined 5-day and 20-day momentum. Isolate the top 2 alpha leaders and the bottom 2 laggards.
(2) Adaptive Volatility Check: Comment on whether the current return spread between the leading sectors and SPY is historically wide or narrow given the current volatility regime. Does the spread indicate a high-conviction institutional rotation or basic market noise?
(3) Concentration Audit: Cross-reference the cap-weighted momentum with the provided breadth metrics. Is the sector move driven by broad participation, or is it heavily distorted by 2 or 3 mega-cap components?
(4) Identify "Emerging Rotations" (5-day momentum accelerating against a weak 20-day trend) and "Contradictory Sectors" (5-day and 20-day signals pointing in opposite directions).
Do not introduce external market data or third-party commentary. Keep the output scannable and direct.
Levels 4 & 5: Extracting Alpha Leaders and Filtering Event Risk
Once your AI prompt isolates a sector backed by true market breadth, open your stock screener of choice (TradingView, Finviz, or StockCharts) and filter specifically for stocks inside those chosen sectors using these baseline technical criteria:
Liquidity Floor:
Minimum average daily volume of 500,000 shares. Below this, bid-ask spreads widen, fills become sloppy, and slippage destroys your edge during volatile sessions.
Relative Strength (RS) Filter:
Stocks outperforming SPY by more than 5% over a rolling 20-day period.
(Note: For defensive, low-beta sectors like Utilities (XLU) or Staples (XLP), lower this relative strength threshold to 2% to 3% to avoid filtering out steady, low-volatility institutional accumulation cycles.)
Price Structure:
Ensure the resulting tickers are trading near actionable technical levels–such as tight consolidations, pullbacks to key moving averages, or high-volume breakout levels.
The daily watchlist process uses recent ETF performance data for sector selection. For a more systematic framework covering business cycle positioning and rotation phase identification, How to Run Sector Rotation Analysis with AI covers the full methodology with a weekly update cadence.
The Upgraded Stock Selection & Quality Ranking Prompt
To prevent the AI from defaulting to name recognition or raw, single-day percentage gains, this prompt strictly defines technical Asset Quality as consistent, orderly daily relative strength accumulation rather than erratic, single-day gap events. It also incorporates a critical event risk filter:
text
Act as an equity analyst ranking specific trading candidates within the [INSERT LEADING SECTOR NAME] sector.
This sector has been confirmed as a structural leader with healthy market breadth. Below is the raw screener data for stocks within this sector alongside an upcoming corporate earnings/events calendar.
Screener Data Input: [PASTE FILTERED SCREENER RESULTS HERE]
Upcoming Events Calendar: [PASTE EARNINGS / BINARY EVENTS DATES FOR THESE TICKERS]
Based only on this input, complete the following analysis:
(1) Identify the top 3 alpha leaders showing the highest "Asset Quality." Quality is explicitly defined here as consistent daily relative strength gains and orderly intraday price ranges over both timeframes, rather than a single erratic gap day or highly volatile price spikes.
(2) Flag "Extended Risks"–names where the 5-day return represents an unsustainably high percentage of the 20-day move, indicating short-term exhaustion risk.
(3) Binary Catalyst Purge: Identify any tickers on this list that have an upcoming corporate earnings report, major product launch, or known regulatory decision within the next 10 trading days. Flag these for immediate removal from the active watchlist.
Rank these candidates strictly by technical asset quality and safety from binary event risks. Do not introduce external fundamental data.
The "No Clear Leader" Operational Rule
A common trap for retail traders is forcing a trade when the market is whippy, unaligned, or completely flat.
Your daily top-down routine must accommodate the scenario where the AI analysis reveals no decisive sector leadership, or where the only leading sectors are defensive names completely out of alignment with a bearish macro environment.
On these days, the correct output of your workflow is an empty watchlist.
Accepting that an empty watchlist is a highly profitable, valid trading decision is what separates professional process-driven execution from impulsive gambling. If the data funnel does not yield high-probability setups with broad sector participation, your default action is to protect your capital, sit in cash, or dramatically reduce your active position sizing.
Real-World Case Study: The Q4 2024 Infrastructure Cycle
To see this system working under real market conditions, look at how this pipeline handled the massive AI infrastructure and energy rotation in late 2024.
Level 1 (Macro):
The Federal Reserve had entered a definitive interest rate easing cycle. Broad market risk appetite was constructive, index futures were consistently positive, and capital discount rates were falling.
Level 2 & 3 (Sector & Breadth):
When the performance matrix was fed to the AI, it flagged an immediate, powerful divergence. While Technology (XLK) remained strong, Utilities (XLU) and Industrials (XLI) were flashing massive 20-day relative strength outperformance (+7% vs. SPY).
Crucially, the equal-weighted utility metrics confirmed that this wasn't just a move in a single mega-cap utility name; over 75% of the sector constituents were trading above their 20-day moving averages. The AI noted that this was a structurally healthy rotation: data centers required immense power generation, and lower interest rates drastically reduced the capital expenditure costs for utility engineering firms.
Level 4 & 5 (Stock & Event Filtering):
The screener for XLU and XLI components with volume over 500,000 shares was fed into the stock ranking prompt. Rather than telling the trader to buy overextended momentum names that had gapped up 15% in a single session, the AI isolated names undergoing steady, orderly institutional accumulation near technical consolidation zones (such as Constellation Energy (CEG) and GE Vernova (GEV)).
Tickers with earnings scheduled inside the 10-day swing trading window were systematically purged, leaving a squeaky-clean, high-probability watchlist.
Scalability: Automating the Data Pipeline
The manual workflow–opening screeners, copying tables, and pasting text into an LLM–is perfectly adequate for monitoring a tight watchlist of 2 to 3 core positions.
However, if you are tracking a larger watchlist of 15 to 20 highly active stocks across multiple sectors, this manual loop quickly becomes an unmanageable administrative bottleneck.
To scale this system to an institutional level, look to automate the ingestion layers:
Programmatic API Ingestion:
Use basic Python scripts leveraging free libraries (like yfinance or the SEC EDGAR API) to pull sector returns and market breadth metrics automatically at the market close.
LLM API Workflows:
Pass that structured JSON data directly into your LLM's API endpoint using your custom system prompts.
This allows you to generate a fully formatted, top-down analytical briefing sheet on your desktop before your morning coffee is finished brewing. The edge does not belong to the AI tool itself; it belongs to the rigidity of the filtering framework.
Watchlist & Sector Analysis: Frequently Asked Questions
What should I do if the AI identifies an "Emerging Rotation" that contradicts the broader macro environment?
Trust the price action, but tighten your risk parameters. If capital is aggressively flowing into a defensive sector like Utilities (XLU) while the macro environment seems highly "risk-on," institutional money managers are likely quietly hedging against an unannounced or unseen macro shift. Trade the leading stocks in that sector, but treat the setup as higher risk until the macro data aligns with the price flow.
What are the main limitations of copy-pasting raw screener text into an LLM?
Data truncation and table format degradation. If your screener output contains dozens of columns or hundreds of rows, the AI can lose track of rows or hallucinate numeric correlations due to attention dilution. Keep your screener output lean by capping your manual inputs to the top 15–20 candidates per sector before prompting the AI.
How do I handle days when index futures are highly volatile or gap significantly at the open?
On high-volatility gap days, Level 1 (Macro) takes precedence over everything else. If the market is gapping down significantly on an unexpected geopolitical event or inflation print, even the strongest stock in the strongest sector will likely face initial selling pressure. Use your AI watchlist to find the names showing the highest relative strength during the market route; those will be your primary long candidates the moment the broader index finds an intraday floor.
How often should I update the historical "baseline summary" for a sector?
You should refresh your core sector momentum benchmarks every 5 trading days. Because a standard swing trading holding period lasts between 5 and 15 days, updating your sector breadth and ETF return tracking on a rolling weekly basis ensures that your baseline models stay perfectly synchronized with real-time institutional rotation cycles.