
Agricultural price spikes are the commodity event that most equity traders dismiss until it is too late. Oil spikes get immediate Wall Street coverage. Copper moves get the macro crowd's attention. But wheat doubling in price? That gets filed under "not my market."
It is your market. A sustained agricultural price spike feeds directly into CPI food components, compresses Consumer Staples margins, strains emerging market economies, and – through the biofuel channel – crosses into energy pricing. In extreme cases, as the Arab Spring demonstrated in 2010–2011, food price spikes destabilize governments and trigger geopolitical events that then move every other asset class. If you’re looking for an agricultural commodities playbook that connects grain prices to real-world sector rotations, you’ll find it here.
Agricultural commodities are the most underestimated transmission mechanism in this whole series. This hub explains why – and what to do when they move.
Why Agricultural Prices Matter Far Beyond the Farm
Agricultural commodities occupy a unique position in the market catalyst hierarchy. Unlike oil or copper, they are not a direct cost input for most businesses. Unlike gold, they carry no financial signalling function. Their transmission runs through a specific and underappreciated channel: food prices into consumer inflation into policy response. In short, wheat price impact on the economy travels through grocery aisles before it ever hits factory floors, and that makes the timing different.
This channel has three critical properties that set it apart from every other commodity transmission in this series.
First, the impact is regressive by income. Food represents 10–12% of household expenditure for upper-income groups in developed markets, but 30–50% for lower-income households and 50–70% in many emerging market economies. When wheat and corn double in price, the pressure is not evenly distributed – it concentrates on the consumers with the least discretionary buffer, the fastest behavioral response, and the least political patience. This is why food price spikes are uniquely destabilizing in a way that oil spikes are not.
Second, the transmission to CPI is fast and visible. Central banks track energy prices but try to "look through" them as volatile. Food prices are harder to ignore – they appear on every grocery receipt, they drive consumer sentiment surveys, and they show up prominently in the CPI food-at-home component within one to two months of the commodity spike. A sustained agricultural spike forces a Fed response faster than most equity traders anticipate, and understanding food prices and Fed policy dynamics gives you a genuine timing edge.
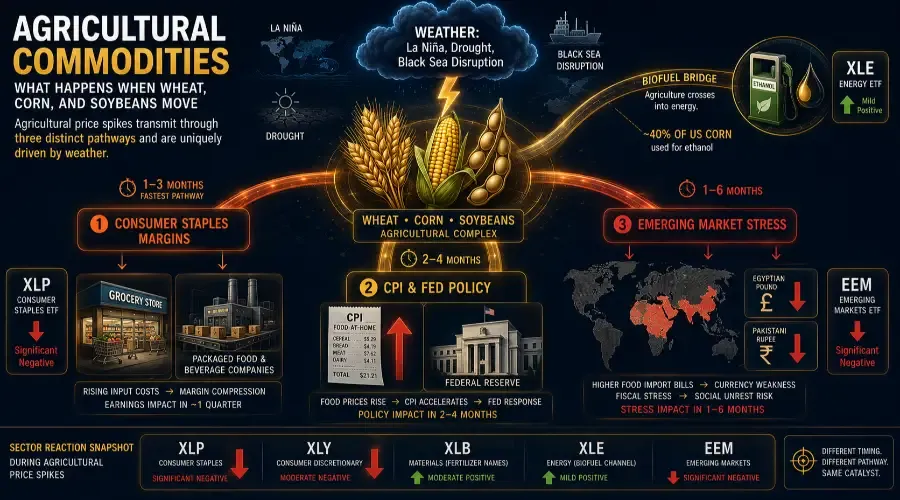
Third, the biofuel channel links agriculture directly to energy. Approximately 40% of US corn production is converted to ethanol. Soybean oil is a primary feedstock for renewable diesel and biodiesel. This means a sustained corn or soybean price spike raises biofuel production costs, which pressures gasoline blenders and energy companies – and vice versa. An oil price spike that makes biofuels more economically attractive pulls additional corn and soybean demand into the energy complex. The agriculture-energy price link is a two-way transmission that most analysts treat as one-directional.
The Agricultural Transmission Mechanism: How It Moves Through the Economy
Agricultural price shocks transmit through three distinct pathways, each with different timing and sector impact. While industrial metals transmit through construction and capex, agricultural transmission is primarily a consumer inflation story – and that makes CPI food inflation drivers your most important tracking indicators.
Pathway 1: Food Inflation into Consumer Staples (1–3 Months)
Consumer Staples companies (XLP) are the most directly exposed sector to agricultural price moves in the equity market. Packaged food companies, beverage producers, and restaurant chains all carry grain, oilseed, and soft commodity inputs throughout their cost structures. Kellogg's uses wheat. Tyson uses corn (as animal feed). Nestlé uses cocoa, coffee, and soy. Coca-Cola uses corn-derived sweeteners.
The typical lag from an agricultural commodity spike to reported margin impact is one quarter – the length of time it takes existing inventory and hedging programs to be exhausted and current spot prices to begin flowing through cost of goods sold. Management commentary on this pressure typically appears in earnings calls two to three months after the commodity move.
The market often pre-prices this margin compression within weeks of the commodity spike, making XLP one of the fastest-reacting sectors to agricultural events despite its reputation as a slow-moving defensive sector.
What to watch: XLP relative performance versus SPY in the weeks following an agricultural spike. If XLP is underperforming despite the broader market holding up, food cost pressure is being priced before the earnings confirmation arrives.
Pathway 2: CPI Food Components into Fed Policy (2–4 Months)
Agricultural spikes that persist for two or more months begin appearing materially in the CPI food-at-home component. The Bureau of Labor Statistics tracks food prices monthly, and a sustained agricultural spike will show up in consecutive CPI prints – forcing the Fed to acknowledge it in their communications even if they initially characterize it as "transitory."
The policy implication depends on the macroeconomic context. An agricultural spike arriving when the Fed is already fighting inflation (as in 2022) compounds the tightening pressure. The same spike arriving when the Fed is in easing mode can delay or derail a planned rate cut cycle – which is the more subtle but equally important scenario.
The 2022 Ukraine wheat shock illustrates this perfectly: the February 2022 invasion sent wheat prices from 800 to 1,300 per bushel in weeks. The food CPI component accelerated sharply, contributing directly to the 9.1% CPI peak in June 2022 that pushed the Fed to its most aggressive hiking pace in four decades.
Pathway 3: Emerging Market Stress (1–6 Months)
This is the most globally consequential pathway and the most overlooked by developed-market equity traders. Wheat, corn, and rice are caloric staples across North Africa, the Middle East, Sub-Saharan Africa, and South and Southeast Asia. When prices spike, governments that subsidize food face exploding fiscal deficits. Governments that don't face social unrest.
The market expression of this pathway is through emerging market currencies, sovereign credit spreads, and EM equity indices. Countries with high food import dependency and limited foreign exchange reserves – Egypt, Pakistan, Bangladesh, many Sub-Saharan nations – face a balance of payments deterioration when agricultural prices spike, because their import bills rise while their export revenues (often also commodity-dependent) may not.
What to watch: The Egyptian pound, Pakistani rupee, and Bangladeshi taka are real-time barometers of agricultural price stress in food-import-dependent economies. If these currencies are weakening simultaneously with a wheat spike, the EM stress pathway is active – and it carries feedback risk into global risk sentiment.
The Weather Market: Why Agriculture Is Uniquely Unpredictable
Every other commodity in this series moves primarily on demand signals, policy decisions, or geopolitical events. Agricultural prices uniquely move on weather – which is the least predictable input in financial markets.
The three weather events that most consistently drive agricultural price spikes:
La Niña (and El Niño):
La Niña typically brings drought to key South American growing regions (Argentina and Brazil, which together supply over 50% of global soybean exports) while El Niño brings floods to Southeast Asian rice-growing regions. The NOAA seasonal outlook for La Niña or El Niño conditions, released months in advance, is one of the earliest tradeable agricultural signals available.
US Midwest drought:
The US Corn Belt (Iowa, Illinois, Indiana, Nebraska) and Wheat Belt (Kansas, Oklahoma, Texas) are the world's most important grain-producing regions. A sustained summer drought – measured by the US Drought Monitor, published weekly – is the primary driver of corn and wheat price spikes in normal non-geopolitical years. The 2012 US drought sent corn from 5 to 8 per bushel in six weeks – the fastest agricultural price move since the 1980s.
Black Sea disruption:
Ukraine and Russia together supply approximately 30% of global wheat exports and significant shares of corn and sunflower oil. Any disruption – war, export restrictions, port closures – in this region produces immediate global wheat price spikes that are geopolitical in origin but agricultural in transmission. The 2022 invasion was the most extreme modern case, but Russian export taxes and Ukrainian harvest disruptions have produced smaller versions of this shock repeatedly since 2010.
The weather market dynamic means agricultural catalyst timing is less predictable than any other hub in this series. The best traders in this space do not try to predict weather – they monitor the weekly USDA Crop Progress Report and position when the data confirms a developing supply problem, not when forecasts suggest one might emerge.
Sector Reaction Map: Agricultural Price Spike vs. Agricultural Price Collapse
Materials (XLB) shows a ✅ Moderate Positive impact during an agricultural price spike, and a ❌ Moderate Negative impact during an agricultural price collapse, with the primary timing being Immediate (fertilizer names).
Energy (XLE) shows a ✅ Mild Positive impact during an agricultural price spike, and a ❌ Mild Negative impact during an agricultural price collapse, with the primary timing being 1–3 Months (biofuel channel).
Consumer Staples (XLP) shows a ❌ Significant Negative impact during an agricultural price spike, and a ✅ Significant Positive impact during an agricultural price collapse, with the primary timing being 1–3 Months.
Consumer Disc. (XLY) shows a ❌ Moderate Negative impact during an agricultural price spike, and a ✅ Moderate Positive impact during an agricultural price collapse, with the primary timing being 2–4 Months.
Industrials (XLI) shows a ➡️ Minimal impact during an agricultural price spike, and a ➡️ Minimal impact during an agricultural price collapse, with the primary timing being Indirect only.
Technology (XLK) shows a ➡️ Minimal impact during an agricultural price spike, and a ➡️ Minimal impact during an agricultural price collapse, with the primary timing being Indirect only.
Healthcare (XLV) shows a ➡️ Minimal impact during an agricultural price spike, and a ➡️ Minimal impact during an agricultural price collapse, with the primary timing being Indirect only.
Utilities (XLU) shows a ➡️ Minimal impact during an agricultural price spike, and a ➡️ Minimal impact during an agricultural price collapse, with the primary timing being Indirect only.
Real Estate (XLRE) shows a ➡️ Minimal impact during an agricultural price spike, and a ➡️ Minimal impact during an agricultural price collapse, with the primary timing being Indirect only.
Financials (XLF) shows a ❌ Negative (EM loans) impact during an agricultural price spike, and a ✅ Positive impact during an agricultural price collapse, with the primary timing being 2–6 Months.
EM Equities (EEM) shows a ❌ Significant Negative impact during an agricultural price spike, and a ✅ Significant Positive impact during an agricultural price collapse, with the primary timing being 1–4 Months.
(✅ = Positive, ❌ = Negative, ➡️ = Minimal Impact)
The unique feature of this sector map: XLB is positive during an agricultural spike – not because of the agricultural commodities themselves, but because the Materials sector includes fertilizer companies (Mosaic, Nutrien) whose revenues are directly tied to fertilizer demand, which spikes when crop prices are high enough to justify increased input spending by farmers. This is the most important sub-sector call in the agricultural catalyst playbook.
The EM row is not an ETF within the standard eleven-sector framework but is included here because it is the most consequential transmission channel for agricultural events – and the most ignored by equity traders focused solely on US sectors.
The Biofuel Bridge: How Agriculture Crosses Into Energy
The corn-ethanol and soybean-biodiesel connections are the least understood and most exploitable linkages in agricultural catalyst trading.
Corn and ethanol:
US law mandates blending ethanol into gasoline through the Renewable Fuel Standard. Approximately 5.6 billion bushels of corn (40% of annual US production) go into ethanol production annually. When corn prices spike, ethanol production costs rise – which either compresses refiner blending margins or raises gasoline prices, depending on the regulatory environment. The Renewable Identification Number (RIN) credit market, which regulates compliance with blending mandates, becomes volatile during corn price spikes and is a direct transmission mechanism from corn prices to gasoline economics.
Soybeans and renewable diesel:
Soybean oil is the fastest-growing feedstock for renewable diesel and sustainable aviation fuel. As mandated blending percentages increase under US and EU green energy policy, the soybean oil-to-diesel price relationship has tightened significantly since 2021. A soybean spike now carries a direct renewable energy cost implication that did not exist five years ago.
The trading implication: During a major corn or soybean spike, screen for refinery and biofuel producer names within XLE. The companies with the highest biofuel exposure (and least feedstock hedging) are the most vulnerable to agricultural cost pressure inside the energy sector.
Key Historical Agricultural Events and What They Produced
2010–2011: The Arab Spring Food Price Crisis
The FAO Food Price Index hit its all-time record in February 2011, driven by wheat, corn, and sugar price spikes following Russian drought-driven export bans, US corn ethanol demand growth, and La Niña impacts on South American production. The political transmission was historic – food price pressure was a documented accelerant of the revolutions in Tunisia, Egypt, Libya, and Syria. For traders: XLP underperformed significantly in Q1 2011 as packaged food margins compressed. Fertilizer companies within XLB surged as farmer income from high crop prices drove record input spending. EM equities in MENA collapsed – but the EM stress pathway into broader risk assets was contained because the global financial system was not under concurrent stress.
2012: The Great US Drought
The worst US drought since 1956 sent corn from 5.00 to8.49 per bushel between June and August 2012. Soybean prices reached their all-time record of $17.89 per bushel. XLP earnings guidance was cut across major packaged food companies in Q3 2012 earnings calls. Tyson Foods – one of the largest corn consumers in the US as an animal feed buyer – issued a profit warning directly attributing margin compression to corn prices. The 2012 drought is the cleanest case study for the agricultural spike → XLP margin compression chain in a non-geopolitical, purely weather-driven context.
2022: Ukraine War Wheat Shock
Russia's invasion of Ukraine removed approximately 25–30% of global wheat export supply within weeks. Wheat prices rose 60% in the first month of the conflict. The transmission into CPI food components was measurable within 60 days – the BLS food-at-home index accelerated sharply in the April and May 2022 prints. This case study is the definitive modern example of the geopolitical agricultural spike → CPI → Fed policy chain running at maximum velocity. The Fed's June 2022 emergency 75bp hike – the largest since 1994 – was partly a response to the food and energy inflation that the Ukraine war had injected into an already overheating economy.
How to Trade Agricultural Catalyst Events: The Three-Phase Checklist
Use this checklist before, during, and after any major agricultural price move. One note of caution: agricultural markets can gap violently on WASDE report days or unexpected weather – position size accordingly and respect the volatility.
Before an agricultural event:
Check USDA Crop Progress Report (released every Monday during growing season) – crop condition ratings below 60% "good to excellent" signal developing supply stress
Monitor NOAA La Niña / El Niño forecast for South American crop season risk
Check Black Sea export activity via commodity shipping data – reduced Ukrainian port loadings are an early geopolitical supply signal
Identify which XLP names have the highest unhedged grain exposure in their next reporting quarter
During the event:
Track fertilizer stocks (Mosaic, Nutrien) within XLB – they are the clearest equity signal that the agricultural spike is being taken seriously by institutional money
Monitor EM currency performance (Egyptian pound, Pakistani rupee) as a leading indicator of food price stress in import-dependent economies
Watch RIN credit prices for the corn-ethanol transmission into gasoline economics
After the event (the lagged trades):
Set a one-quarter reminder to review XLP earnings guidance specifically for cost of goods sold commentary on grain and oilseed costs
Review CPI food-at-home component in the two monthly prints following the commodity spike
If the spike has fed into CPI and the Fed is acknowledging it, reassess the broader rate outlook – the agricultural shock may have changed the policy path
Trading from outside the US? The same transmission logic applies globally – use local agricultural commodity ETFs or food producer sector indices to track the identical pathways
Two Agricultural Events Covered in This Hub
→ What Happens When Wheat and Corn Prices Spike (Medium priority – 600+ monthly searches)
The primary food security event in global markets. Covers the full CPI transmission chain, Consumer Staples margin compression trade, the Black Sea geopolitical supply dynamic (with the 2022 Ukraine case as the centrepiece), the US drought scenario using 2012 as the case study, and the emerging market stress pathway. Also covers the export restriction dynamic – when major producing nations ban exports, the price spike accelerates and the EM pathway becomes acute.
→ What Happens When Soybean Prices Move Sharply (Medium priority – 500+ monthly searches)
Soybeans occupy a unique position because they are simultaneously a food commodity (soy protein, animal feed), an industrial commodity (soybean oil for biofuels), and a China trade relationship barometer (China buys 60% of global soybean exports). Covers the La Niña South American crop risk, the US-China trade war soybean embargo of 2018 as a case study in geopolitically-driven agricultural disruption, the renewable diesel demand driver, and the Brazilian real as the world's best soybean price proxy currency. [link]
Continue Through the Catalyst Series
→ Pillar: The Complete Market Catalyst Framework
→ Hub 1: Energy Commodities – Oil, Gas, Uranium
→ Hub 2: Industrial & Base Metals – Copper, Steel, Lumber
→ Hub 3: Precious Metals – Gold, Silver, Platinum
→ Hub 5: Macroeconomic Events – Fed, CPI, NFP, GDP
→ Hub 6: Central Bank & Policy – QE, Tapering, Tariffs, Tax
→ Hub 7: Geopolitical Events – Wars, Elections, OPEC, EM Crisis
Frequently Asked Questions
1. Why do wheat and corn prices affect inflation?
Wheat and corn are major food inputs globally. Rising grain prices increase grocery costs, which feed directly into the CPI food component and raise inflation pressure.
2. How do agricultural commodity prices affect the stock market?
Agricultural price spikes impact Consumer Staples companies, food producers, fertilizer firms, emerging markets, and inflation-sensitive sectors through rising input costs and CPI pressure.
3. What causes agricultural commodity prices to spike?
The main drivers are droughts, La Niña or El Niño weather patterns, geopolitical disruptions, export bans, and supply chain constraints.
4. Why are food price spikes dangerous for emerging markets?
Many emerging markets depend heavily on food imports. Rising food prices increase fiscal pressure, weaken currencies, and can trigger political instability and social unrest.
5. How does corn impact energy prices?
Around 40% of US corn production is used for ethanol. Rising corn prices increase ethanol production costs, linking agricultural prices directly to fuel economics.
6. What is the connection between soybeans and renewable diesel?
Soybean oil is a major feedstock for renewable diesel and biodiesel. Rising soybean prices can increase renewable fuel production costs.
7. Which sectors benefit from agricultural price spikes?
Fertilizer companies within the Materials sector often benefit because higher crop prices encourage farmers to spend more on agricultural inputs.
8. How does La Niña affect agricultural commodities?
La Niña often causes drought conditions in South America, reducing crop yields for soybeans and corn and increasing global agricultural prices.
All content on BreakoutBulletin is for educational purposes only and does not constitute financial advice or a recommendation to buy or sell any security.