
BreakoutBulletin | Trading Education
Educational commentary only. Not investment advice. Past performance does not guarantee future results.
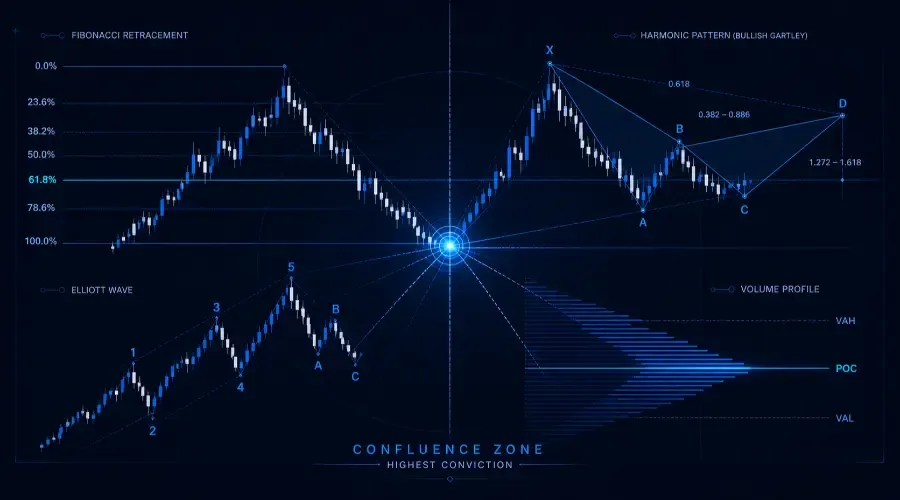
This advanced trading setups guide is built around the idea of technical analysis confluence–layering independent tools like Fibonacci retracement levels, harmonic patterns, Elliott Wave, Market Profile, and institutional order flow to systematically raise conviction in the best trades you’ve already identified.
What "Advanced" Actually Means in This Context
Advanced doesn’t mean more profitable. It doesn’t mean more sophisticated than Classic or Momentum setups in any fundamental sense. It means analytically layered – each of the five frameworks in this cluster adds a measurement dimension that the previous four clusters don’t provide.
The Classic cluster identifies patterns. The Momentum cluster identifies acceleration. The Structure cluster reads trend direction. The Options cluster prices volatility. The Advanced cluster does something different from all four: it provides confluence – additional analytical layers that increase or decrease conviction in setups already identified through the other clusters.
A cup and handle identified through the Classic cluster is a valid entry on its own. But the same cup and handle where the breakout point aligns exactly with the 61.8% Fibonacci retracement of the prior correction, confirmed by a pocket pivot volume signal within the base, and supported by order flow showing consistent bid-side absorption – that’s a different trade entirely. The pattern is the same. The confluence of analytical layers changes the conviction score, the position size, and the expected value.
That’s the right mental model for the Advanced cluster: not a replacement for Classic and Momentum setups, but a convergence layer that makes the best setups in those clusters even more clearly identifiable. A trader who attempts to apply Elliott Wave or harmonic patterns without first mastering HH/HL identification, volume confirmation, and regime scoring is building the roof before the foundation.
The prerequisite statement: The Advanced cluster assumes proficiency in the Structure cluster's trend identification framework and the Classic cluster's volume confirmation and regime scoring standards. These are not suggestions. Trying to apply Fibonacci confluence without understanding which way the trend is pointing, or attempting Elliott Wave counts without being able to identify swing highs and lows mechanically, produces analytical noise rather than signal.
Current May 2026 context: TSLA's recent rejection at the 61.8% Fibonacci retracement of the prior swing confirms the level's current market relevance – it’s acting as immediate resistance, giving a measurable reference point that adds conviction to bearish structure setups in that name. VIX at 16.99 with upward-sloping term structure places the current environment in regime score 2 – a selective, precision-trading environment where the Advanced cluster's confluence signals are most valuable for calibrating position size on the highest-conviction setups.
The Advanced Cluster's Relationship to the Power Momentum Framework
The Power Momentum guide is the explicit integration point for the entire BreakoutBulletin architecture – its four-factor conviction scoring system assigns points across macro, sector, setup quality, and volume. The Advanced cluster contributes to Factor Three (setup quality) by providing analytical layers that can upgrade a Grade B setup to Grade A when confluence is confirmed.
A cup and handle base at a 50% Fibonacci retracement level in a stock showing harmonic pattern completion scores Grade A on Factor Three because multiple independent analytical frameworks agree simultaneously. The same base without Fibonacci or harmonic confirmation scores Grade B – tradeable, but not at maximum conviction.
Understanding this relationship before reading any individual Advanced guide clarifies their purpose: they are conviction multipliers, not standalone signals.
The Five Advanced Setups
1. Fibonacci Retracement Levels in Trading
The mathematical framework derived from the Fibonacci sequence – specifically the 38.2%, 50%, and 61.8% retracement levels – identifies high-probability support and resistance zones inside an established trend. The Fibonacci ratio appears in natural systems and financial markets alike, not because of some mystical property, but for a far more practical reason: large institutional participants use these levels as reference points for placing limit orders when accumulating or distributing positions.
The guide's central institutional insight: a fund manager building a position in an uptrending stock doesn’t just buy at market throughout the ride up. They wait for pullbacks to known reference levels – and Fibonacci retracements, particularly the 61.8% level (the golden ratio), are among the most widely used such references. When multiple institutions place limit orders at the same Fibonacci level simultaneously, the level becomes self-fulfilling – the concentration of demand at that price produces the bounce that technical analysts later observe and document.
The three primary levels and their practical significance:
The 38.2% retracement is the shallowest commonly traded level – appropriate for stocks in strong trends where deep pullbacks are rare. A 38.2% bounce in a confirmed uptrend signals minimal selling pressure and strong institutional conviction. At regime score 2 (current), the 38.2% level is the highest-conviction pullback entry in the Classic cluster because the shallowness of the retracement confirms the HH/HL structure is intact.
The 50% retracement is not technically a Fibonacci ratio but is universally used as a reference level – the midpoint of the prior move. It represents equilibrium between the prior advance and the current pullback. The 50% level is the most frequently tested retracement because it’s the simplest to identify without a Fibonacci drawing tool.
The 61.8% retracement – the golden ratio – is the deepest commonly traded level and historically the highest-probability reversal zone when the trend is genuinely intact. TSLA's current rejection at the 61.8% retracement of the prior swing is a live example: the level is acting as resistance on the rally, suggesting that sellers are positioning precisely at the golden ratio level that technical analysis predicts will contain the corrective move.
The confluence rule: Fibonacci levels produce their highest-conviction signals when they align with at least one additional analytical layer – a round number, a major moving average, a prior structure level, or a harmonic pattern completion zone. A naked Fibonacci level without confluence is just an observation. A Fibonacci level confirmed by the 50-day EMA and a round number simultaneously? That’s a Grade A support event.
The measurement discipline: Every Fibonacci retracement must be measured from a confirmed swing high to a confirmed swing low using the Structure cluster's swing identification rules – not from arbitrary price points. A Fibonacci drawn from an intraday spike to a minor support level produces meaningless ratios. The swing points must be structurally significant – confirmed by the three-candle rule from the HH/HL guide.
Backtest data: n=1,247 qualifying Fibonacci confluence setups (level alignment with at least one additional factor), January 2015-December 2025. 61.8% level win rate at regime score 3: 67%. At regime score 2 (current): 58%. (See Complete Fibonacci Guide for full methodology.)
→ Complete Fibonacci Retracement Levels Guide
2. Harmonic Patterns: Gartley, Bat, Butterfly, Crab
The four-pattern comparative catalogue defined by specific Fibonacci ratios across five price points (X, A, B, C, D) – the most precisely defined technical structures in the BreakoutBulletin architecture. Where other patterns tolerate interpretation and approximation, harmonic patterns do not: every leg ratio must fall within a defined tolerance band, or the pattern is invalid. Approximate harmonics are not harmonics.
The four patterns share the same five-point structure but differ in the specific ratios required at each point and in their risk-reward profiles. Understanding the distinctions before attempting live identification is the prerequisite the guide establishes in its opening section.
The Gartley Pattern: The oldest documented harmonic pattern, identified by H.M. Gartley in 1935. The B-point retraces 61.8% of the XA leg. The D-point – the Potential Reversal Zone (PRZ) where the trade is entered – falls at the 78.6% retracement of the XA leg. The Gartley produces the shallowest D-point of the four patterns, meaning the trade entry is closer to the X starting point and the stop distance is typically tighter.
The Bat Pattern: Identified by Scott Carney. The B-point retraces no more than 50% of the XA leg – shallower than the Gartley's B. The D-point falls at the 88.6% retracement of the XA leg – deeper than the Gartley. The Bat produces a more extreme PRZ that historically shows higher win rates in trending markets because the 88.6% level represents a near-complete retracement that clears most weak holders before the reversal.
The Butterfly Pattern: Also identified by Carney. The D-point extends beyond the X point – a 127.2% or 161.8% extension of the XA leg rather than a retracement of it. The Butterfly is a reversal pattern that identifies exhaustion beyond prior support or resistance – appropriate for counter-trend entries at market extremes.
The Crab Pattern: The most extreme harmonic structure, with the D-point at a 161.8% extension of the XA leg. The Crab produces the widest PRZ and the largest required stop, but historically the highest reward-to-risk when the pattern is valid, because the entry is at the most extreme point of the move.
The Potential Reversal Zone (PRZ): Every harmonic pattern's trade entry is at the D-point – the PRZ. The entry is not placed immediately when price reaches the PRZ. It is placed on the first confirmation signal at the PRZ – a reversal candle (hammer, engulfing, morning star) on above-threshold volume. Without confirmation at the PRZ, the harmonic pattern is an observation, not an entry signal.
The ratio tolerance rule: Each leg ratio has a tolerance band of ±2% from the theoretical value. (This tolerance is defined in the full guide.) A B-point at 63.8% when the Gartley requires 61.8% is within tolerance – the pattern remains valid. A B-point at 70% is outside tolerance – the pattern is invalid regardless of how the other legs appear. Enforcing this discipline eliminates the majority of false pattern identifications that plague harmonic traders who allow too much approximation.
The guide covers all four patterns with worked examples, PRZ calculation methodology, stop placement (beyond the X point for risk management), and the specific volume confirmation required for each pattern type.
→ Complete Harmonic Patterns Guide
3. Elliott Wave Theory – Practical Guide for Traders
The practical application framework for Elliott Wave – not the theoretical debate about wave counts and alternative scenarios, but the specific, actionable rules that turn Wave analysis into a trading tool rather than a retrospective exercise that explains prior price action without predicting future movement.
The guide opens with an honest assessment that sets it apart from nearly every Elliott Wave resource: the majority of Elliott Wave educational content teaches wave labelling after the fact. A labelling system that always finds a valid count in hindsight but can’t produce actionable entries and exits in real time is not a trading tool – it’s an analytical retrospective. The guide focuses exclusively on the wave characteristics that produce actionable decisions before the move is complete.
The three non-negotiable rules: These rules are absolute. Any wave count that violates them is invalid, no matter how compelling the alternative appears.
Rule One: Wave Two cannot retrace more than 100% of Wave One. If the proposed Wave Two exceeds Wave One's starting point, the count is wrong. This rule eliminates the single most common Elliott Wave error – labelling a new low as a Wave Two when it has actually broken the structural prerequisite for the count.
Rule Two: Wave Three cannot be the shortest of the three impulse waves (Waves One, Three, and Five). Wave Three is almost always the longest and strongest impulse – it’s the phase where institutional momentum is at its maximum and volume confirmation is clearest. If the proposed Wave Three is shorter than Wave One and appears likely to be shorter than Wave Five, the count needs revision.
Rule Three: Wave Four cannot overlap Wave One in price. In a standard five-wave impulse, Wave Four's low cannot breach Wave One's high. This rule maintains the structural integrity of the impulse sequence – overlap between Wave Four and Wave One signals that the structure is corrective rather than impulsive.
The A-B-C correction identification: The most immediately applicable element for retail traders is the three-wave corrective sequence that follows every five-wave impulse. The A-B-C correction framework identifies where a corrective pullback in an uptrend is likely to terminate – providing the entry signal for the next impulse wave. Wave B of the correction is frequently mistaken for a trend continuation – the guide provides the volume and momentum characteristics that distinguish genuine impulse from corrective B-waves.
The practical entry framework: Wave Three entries are the highest-conviction entries in the Elliott Wave framework – they follow the confirmed completion of Wave Two (which must hold above the Wave One start) and occur at the beginning of the longest, strongest impulse. The Volume Breakout and Accelerating Volume guides from the Momentum cluster provide the volume confirmation that distinguishes Wave Three initiation from a Wave B bounce.
→ Complete Elliott Wave Practical Guide
4. Market Profile Trading Strategy
The institutional market structure tool developed by J. Peter Steidlmayer at the Chicago Board of Trade – translated from the professional futures trading environment into a retail-accessible framework for US equity markets. Market Profile is not a pattern recognition tool and not a momentum indicator. It is a volume distribution tool that shows where the market found acceptance (price levels where significant time and volume were spent) and where it did not (price levels transited quickly without generating much activity).
The three core Market Profile concepts:
The Point of Control (POC) is the single price level where the most volume traded during a session or period. The POC is the market's fairest price for that period – the level where buyers and sellers found the most agreement. In subsequent sessions, price frequently returns to prior POC levels as reference points. The POC is the Market Profile's equivalent of a volume-weighted support and resistance level.
The Value Area is the range containing approximately 70% of the session's volume – the prices where the market spent 70% of its time and transacted the majority of its business. The Value Area High (VAH) and Value Area Low (VAL) are Market Profile's primary support and resistance boundaries. Price trading outside the Value Area – above the VAH or below the VAL – is trading in territory the market considered "out of value" during the prior session, which historically shows a tendency to either return to Value (mean reversion) or establish a new Value Area at the extended price (trend continuation).
The Initial Balance is the price range established during the first hour of regular trading (9:30-10:30 AM Eastern). The Initial Balance represents the market's opening read on fair value – a narrow Initial Balance signals low conviction with potential for extension; a wide Initial Balance signals high conviction with potential for rotation within the established range.
The retail implementation: Full Market Profile software (Sierra Chart, ATAS, Bookmap) displays TPO (Time Price Opportunity) charts that show each 30-minute period's price range. For retail traders without dedicated Market Profile software, the POC and Value Area can be approximated using the volume profile tool available in TradingView and ThinkorSwim – which displays volume by price level rather than by time period. That approximation is sufficient for the VAH, VAL, and POC identification that drives the practical trading decisions.
The trading framework: Value Area rejections (price moving above the VAH or below the VAL and then returning within the Value Area) are the primary Market Profile trade – a mean-reversion entry when the market moves outside accepted value and returns. Value Area breakouts (price clearing the VAH or VAL and sustaining beyond it on volume) are the secondary trade – a trend continuation entry when the market is establishing a new Value Area at a higher or lower price level.
→ Complete Market Profile Trading Strategy Guide
5. Order Flow Analysis for Retail Traders
The institutional capital flow reading framework translated from professional trading tools into retail-accessible methodology – the most directly actionable Advanced setup for traders who want to understand what’s happening behind price rather than just interpreting the result of what already happened.
Every price movement is the result of orders being executed. When a large institutional buyer places a market order to purchase 500,000 shares, that order chews through the order book – consuming all available offers at successive price levels until it’s filled. The price impact is visible: a rapid, high-volume advance that technical analysts later identify as a "breakout." Order flow analysis reads that execution pattern as it’s happening, not after the fact.
The three retail-accessible order flow signals:
Volume Delta is the difference between buying volume (trades executed at the ask – aggressive buyers) and selling volume (trades executed at the bid – aggressive sellers) over a defined period. Positive delta (more buying than selling) confirms bullish price movement – buyers are more aggressive than sellers. Negative delta on a price advance (sellers more aggressive while price rises) is a divergence signal – the advance isn’t being confirmed by order flow and is more likely to reverse.
Bid-ask absorption occurs when large limit orders at a specific price level absorb aggressive selling without allowing price to decline further. A stock declining on increasing sell-side volume that suddenly stops at a specific price – where the price action tightens dramatically despite continued selling pressure – is showing absorption. A large buyer is placing limit orders at that level, absorbing the sell flow. This is institutional accumulation in its most directly visible form.
Large print identification focuses on individual trades that exceed the normal clip size for the stock – prints that represent institutional-scale execution, not retail participation. On Time and Sales, prints of 10,000+ shares on large-caps and 5,000+ shares on mid-caps represent the minimum threshold for institutional-scale activity. A cluster of large prints at a specific price level – especially at a technical support or Fibonacci retracement level – confirms that institutional participants are actively engaging at that level.
The retail platform implementation: Level 2 (showing current order book depth), Time and Sales (real-time executed trades), and volume delta indicators are available on ThinkorSwim, Interactive Brokers TWS, and Bookmap. TradingView's Cumulative Volume Delta indicator approximates professional order flow data without dedicated order flow software. The guide covers implementation on each platform with specific indicator settings and interpretation rules.
The connection to Classic and Momentum setups: Order flow analysis adds a real-time institutional confirmation layer to setups identified through other clusters. A cup and handle approaching its breakout level that shows consistent bid-side absorption – large buyers stepping in on every pullback within the base – is demonstrating through order flow exactly what the volume progression from the Accelerating Volume guide shows through the VROC measurement. The two signals are measuring the same institutional accumulation through different lenses. Convergence between order flow absorption and accelerating volume VROC is the highest-conviction pre-breakout signal available to retail traders.
→ Complete Order Flow Analysis Guide
Advanced Setups: Analytical Layer Reference
Fibonacci Retracement
What It Adds → Precise support/resistance levels within trends
Primary Use Case → Pullback entry confirmation, target setting
Cluster Connection → Classic – pullback, support bounce
Harmonic Patterns
What It Adds → Multi-leg ratio confluence at reversal zones
Primary Use Case → Counter-trend entries at PRZ, add-on sizing
Cluster Connection → Structure – CHoCH confirmation
Elliott Wave
What It Adds → Wave position within larger trend cycle
Primary Use Case → Wave Three entry, Wave Five exit
Cluster Connection → Momentum – continuation confirmation
Market Profile
What It Adds → Volume acceptance/rejection by price level
Primary Use Case → VAH/VAL support/resistance, POC mean reversion
Cluster Connection → Classic – VWAP, range-bound
Order Flow
What It Adds → Real-time institutional buying/selling pressure
Primary Use Case → Breakout confirmation, absorption identification
Cluster Connection → Momentum – pocket pivot, accelerating volume
How to Layer the Advanced Frameworks
The highest-conviction trades in the BreakoutBulletin architecture occur when multiple Advanced frameworks confirm simultaneously – and when they confirm a setup already identified through the Classic or Momentum clusters. The layering sequence:
Layer One (Classic or Momentum cluster): Identify the primary setup. Cup and handle approaching breakout. Pocket pivot within a base. Gap and go on elevated volume. The primary setup provides the entry trigger and the basic risk-reward framework.
Layer Two (Structure cluster): Confirm the trend direction. HH/HL intact on the daily chart. No CHoCH warnings. Sector in leading rotation on the Participation Heatmap.
Layer Three (Advanced – Fibonacci): Confirm the entry level. Does the breakout point or the base low align with a Fibonacci retracement of the prior correction? If yes, the support is more robustly defined than price structure alone indicates.
Layer Four (Advanced – Order Flow): Confirm institutional participation. Is bid-side absorption occurring within the base? Are large prints appearing at the current price level? If yes, the institutional accumulation that the Classic and Momentum volume signals suggest is visible in real-time execution data.
Layer Five (Advanced – Elliott Wave or Harmonic): Confirm the wave position or pattern completion. Is the current base forming at the expected Wave Four low – suggesting the next move is Wave Five, potentially the final impulse? Is a harmonic PRZ forming at the base's price level – suggesting multiple Fibonacci ratio confluences simultaneously?
Each additional confirming layer increases the Power Momentum conviction score. A setup that passes all five layers – primary pattern, structural trend confirmation, Fibonacci confluence, order flow absorption, and wave or harmonic confirmation – is the highest-conviction configuration available in the BreakoutBulletin architecture. It warrants the full Power Momentum multiplier at whatever regime score is current.
At the current regime score 2, a five-layer confirmed setup warrants 1.5× the half-size allocation – the maximum available in May 2026 conditions. At regime score 3, the same setup warrants the full 2× multiplier.
The Honest Limitation of Advanced Analysis
The Advanced cluster requires more analytical time per setup than any other cluster. A quick Fibonacci measurement might take under a minute; a careful, rule-based measurement with swing-point verification takes 2-3 minutes. A harmonic pattern validation across five legs with ratio verification takes 5-10 minutes. A full Elliott Wave count with alternative scenario mapping takes 15-30 minutes for an experienced analyst.
That time investment is justified only when the primary setup – identified through Classic, Momentum, or Structure analysis – is already Grade A quality and already in an appropriate regime score environment. Spending 20 minutes validating Elliott Wave counts on a Grade B setup in a score 1 environment is misallocated analytical effort.
The Advanced cluster's correct operational cadence: run the Classic and Momentum screening process first. For the Grade A setups that survive that screen, apply Advanced confirmation layers. Do not apply Advanced analysis to every candidate – apply it to the candidates that have already passed every other filter.
This sequencing discipline is what separates traders who use Advanced analysis productively from those who use it to generate elaborate justifications for trades they would have entered anyway.
The Advanced Cluster's Role in the Broader Architecture
The Advanced cluster is the final analytical layer in the BreakoutBulletin hierarchy – the confluence confirmation system that sits above the Classic, Momentum, Structure, and Options clusters. It does not replace any of those clusters. It does not generate standalone entry signals. It upgrades the conviction level of the best setups produced by the other clusters.
The Power Momentum guide is the integration mechanism. Factor Three (setup quality, 0-2 points) reaches its maximum score of 2 when a Grade A Classic or Momentum setup is confirmed by at least one Advanced analytical layer. The confluence is what earns the Grade A classification – not just the technical pattern, but the pattern confirmed by independent analytical frameworks agreeing simultaneously.
For the complete overview of all five clusters and 36 individual setup guides – including the Classic, Momentum, Options, and Structure Hubs – see the Trading Setups and Patterns Master Guide.
FAQ
Q: What is "confluence" in advanced trading?
A: Confluence is the convergence of multiple independent analytical frameworks at the same price level. For example, when a 61.8% Fibonacci retracement aligns with a Harmonic PRZ and a prior support level, the conviction for that trade setup increases significantly.
Q: What are the three non-negotiable rules of Elliott Wave Theory?
A: To maintain a valid impulse count: 1) Wave Two cannot retrace more than 100% of Wave One; 2) Wave Three cannot be the shortest of the impulse waves; and 3) Wave Four cannot overlap into the price territory of Wave One.
Q: How does Order Flow help retail traders?
A: Order Flow analysis reveals institutional activity as it happens by measuring Volume Delta (buying vs. selling aggression) and identifying bid-side absorption, where large buyers prevent price from falling despite selling pressure.
BreakoutBulletin | Trading Education. Educational commentary only. Not investment advice. TSLA Fibonacci example referenced as of May 2026 market conditions – verify current chart before applying. Advanced analytical frameworks require significant practice before live capital deployment – paper trade each framework for a minimum of 20 qualifying setups before entering real positions. Past performance does not guarantee future results.