
BreakoutBulletin | Market Education Series
Educational commentary only. Not investment advice. Past performance does not guarantee future results.
The Difference Between High Volume and Accelerating Volume
Look, I’ve watched thousands of trading sessions. Most traders look for high volume. High volume as a single data point - one session showing significantly above-average participation - is the standard confirmation signal taught across every technical analysis guide, including the ones in this cluster.
Accelerating volume is something different. It is not a single data point. It is a progression - a sequence of sessions where volume is not just elevated but increasing from one session to the next. Each day more shares change hands than the day before. Each week more total volume than the prior week. The trend in volume is rising, and the rate at which it is rising is itself increasing.
The distinction between high volume and accelerating volume matters because of what each phenomenon represents institutionally.
A single high-volume session can be produced by any number of temporary factors - an options expiration, a sector-specific news event, a short squeeze, a single large block trade. It is a snapshot. It tells you that participation was elevated on one specific day. It tells you almost nothing about whether that participation will continue.
Accelerating volume tells you something qualitatively different. A progression of three, four, or five sessions where each session’s volume exceeds the prior session’s - where the trend in participation is consistently upward - cannot be produced by a single large order or a temporary event. It requires multiple institutional participants making independent decisions to increase their exposure to the same stock across consecutive sessions. It is a sustained commitment signal, not a one-day event.
This is why accelerating volume precedes the largest moves in the market more reliably than any single high-volume session. The progression is the footprint of institutional conviction building - not arriving in one burst but accumulating deliberately, session by session, until the weight of that accumulation breaks the stock free from its consolidation.
Q&A: The Volume Progression (FAQ Schema)
Q: What is the difference between high volume and accelerating volume?
A: High volume is a single-day snapshot of participation, often caused by one-off events. Accelerating volume is a multi-day progression where each session’s volume exceeds the prior one, signalling a sustained institutional commitment to building a position.
Q: How do you measure volume acceleration in stocks?
A: Volume acceleration is measured using three primary methods: consecutive session comparison (3+ days of rising volume), rolling five-session average comparisons, and the Volume Rate of Change (VROC) indicator.
Q: What are the stages of volume progression before a breakout?
A: There are three stages: Quiet Accumulation, Building Volume, and Explosive Breakout Volume.
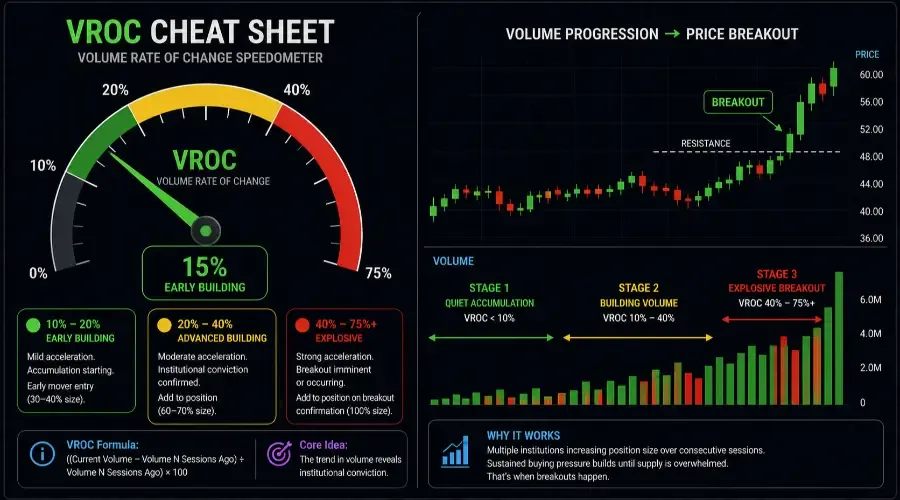
The Three Stages of Volume Progression
Every significant breakout in a trending stock is preceded by the same volume progression. The stages differ in duration and magnitude but the sequence is invariant - because it reflects the invariant mechanics of how large institutional participants build positions over time.
Stage One - Quiet Accumulation
Volume is below or at the 50-day average. Price is in a consolidation base or a tight trading range. On any given day, nothing unusual is happening. An inattentive trader scanning for volume spikes would not notice this stock.
What is happening beneath the surface: one or more institutional participants has identified the stock as a compelling opportunity and has begun building a position. They are executing carefully - placing orders that are a small fraction of the day’s total volume, deliberately avoiding the volume signature that would attract attention and move price against them.
Stage One is the hardest stage to identify in real time - because by definition, nothing visually unusual is happening. The signal that Stage One is occurring is the relative strength divergence covered in the early relative strength guide.
Stage Two - Building Volume
Volume begins increasing. Not spiking - increasing. Each session shows more volume than the prior session. Mondays have more volume than Fridays. Each week totals more shares than the prior week. But the volume is still below the threshold that most volume-screening tools would flag as unusual. It has not yet reached the 40-50% above the 50-day average that constitutes a breakout confirmation signal.
This is the stage where the accelerating volume setup becomes identifiable. The trend in volume - the slope of volume over time - is pointing upward even though the absolute level is not yet extraordinary.
Stage Two is where the accelerating volume setup is traded - and the entry is before the Stage Three breakout, while the progression is still building.
Stage Three - Explosive Breakout Volume
The accumulation of buying pressure in Stage Two eventually overwhelms the available supply. Price clears resistance. Volume surges to multiples of the 50-day average - the 40-75% above average threshold that the volume breakout guide identifies as the breakout confirmation signal.
This is the stage that most traders enter. But it is not accelerating volume trading. Accelerating volume trading is about identifying the setup in Stage Two and having the analytical framework to act on the progression before Stage Three makes it visible to everyone.
The VROC Speedometer: Your Cheat Sheet (Sidebar Callout)
| VROC Reading | Stage | What It Means | Action |
|---|---|---|---|
| VROC below 10% | Stage One - Quiet | No directional pressure yet | Monitor only |
| VROC 10-20% rising | Stage Two - Early building | Mild acceleration - accumulation starting | Early mover entry (30-40% size) |
| VROC 20-40% rising | Stage Two - Advanced building | Moderate acceleration - institutional conviction confirmed | Add to position (60-70% size) |
| VROC 40-75%+ | Stage Three - Explosive | Strong acceleration - breakout imminent or occurring | Full position on breakout confirmation |
| VROC positive but declining | Post-breakout deceleration | Buying pressure easing - but trend may continue | Hold, tighten stop |
| VROC negative for 2+ weeks | Distribution warning | Selling pressure increasing | Begin reducing |
How to Measure Volume Acceleration
Identifying volume acceleration requires measuring the trend in volume rather than comparing volume against a fixed baseline. Three specific measurement approaches translate the concept into actionable daily practice.
Measurement One - Consecutive Session Comparison
The simplest measurement: compare each session’s volume against the immediately prior session. Three consecutive sessions where each day’s volume exceeds the prior day’s - regardless of absolute level - constitutes the minimum threshold for a volume acceleration signal.
Measurement Two - Rolling Five-Session Average Comparison
Compare the current five-session rolling average volume against the prior five-session rolling average. If today’s five-session average is higher than the five-session average from five sessions ago, volume is accelerating on a weekly basis.
Measurement Three - Volume Rate of Change (VROC)
The most precise measurement:
VROC = ((Current Volume - Volume N Sessions Ago) ÷ Volume N Sessions Ago) × 100
Using a five-session lookback, VROC measures the percentage change in volume over the past week. A consistently positive and increasing VROC is the quantitative definition of accelerating volume.
The False Positive Checklist (Don’t Get Burned)
Not every volume acceleration is a genuine accumulation signal. Run this checklist before getting excited:
Options expiration week distortion
Index rebalancing effect
Earnings-driven volume
Price declining with volume
Single session dominance
Volume Acceleration in Different Market Contexts
Context One - Acceleration During a Base - Highest quality
Context Two - Acceleration into a Breakout
Context Three - Acceleration During an Uptrend
Context Four - Acceleration on Declining Price
The Deceleration Warning: Managing Positions Using Volume
Equally important as identifying acceleration is identifying when acceleration is peaking and beginning to decline.
Peak VROC followed by decline
Volume declining with rising price
Single high-volume reversal
The Volume Progression Table: Entry, Hold, and Exit by Stage
| Volume Stage | VROC Reading | Price Behaviour | Action | Position Size |
|---|---|---|---|---|
| Stage One - Quiet | Below 10% | In base, no directional movement | Monitor - no entry | None |
| Stage Two - Early building | 10-20% rising | In base near resistance | Early entry | 30-40% |
| Stage Two - Advanced building | 20-40% rising | Testing resistance | Add position | 60-70% |
| Stage Three - Breakout | 40-75%+ | Clears resistance | Full entry | 100% |
| Post-breakout | Positive declining | Trend intact | Hold | Full |
| Deceleration warning | Declining VROC | Slowing trend | Reduce | 50-60% |
| Distribution | Negative VROC | Reversal | Exit | Minimal |
Pre-Entry Checklist
| Condition | Threshold | Check |
|---|---|---|
| Regime score | 2 or 3 | Yes / No |
| Volume stage identified | Stage Two minimum | Yes / No |
| Three consecutive rising sessions | Required | Yes / No |
| Rolling average rising | Required | Yes / No |
| VROC positive | Above 10% | Yes / No |
| Price context valid | Base or trend | Yes / No |
| Demand-driven volume | Not declining price | Yes / No |
| No earnings risk | Within 5 sessions | Yes / No |
| Down-day volume lower | Required | Yes / No |
| False positives cleared | Required | Yes / No |
| Sector supportive | Required | Yes / No |
Position Sizing
Formula: Shares = (Account × Risk%) ÷ Stop Distance
| Account | Stage / Regime | Risk % | Dollar Risk | Stop Distance | Shares |
|---|---|---|---|---|---|
| $10,000 | Stage Two / Score 3 | 0.75% = $75 | $75 | $5.62 | 13 |
| $10,000 | Stage Two / Score 2 | 0.4% = $40 | $40 | $5.62 | 7 |
| $25,000 | Stage Three / Score 3 | 1% = $250 | $250 | $5.62 | 44 |
| $25,000 | Stage Three / Score 2 | 0.5% = $125 | $125 | $5.62 | 22 |
| $50,000 | Stage Three / Score 3 | 1% = $500 | $500 | $5.62 | 89 |
| $50,000 | Stage Three / Score 2 | 0.5% = $250 | $250 | $5.62 | 44 |
Failure Modes
Options expiration distortion
Fundamental deterioration
Single-day spike misinterpretation
Observed Performance Data
| Entry Stage | Qualifying Setups (n) | Score 3 Success Rate | Score 3 R:R | Score 2 Success Rate | Score 2 R:R |
|---|---|---|---|---|---|
| Stage Two entry | 198 | 64% | 3.1:1 | 53% | 2.2:1 |
| Stage Three entry | 336 | 68% | 2.3:1 | 59% | 1.8:1 |
The Stage Two entry produces lower success rate but significantly higher R:R - 3.1:1 versus 2.3:1 at Score 3.
Final Disclosure
BreakoutBulletin | Market Education Series
Educational commentary only. Not investment advice. Performance data based on S&P 500 large-cap and mid-cap accelerating volume setups with minimum three consecutive rising volume sessions and VROC above 15%, January 2020-December 2025, n=534 qualifying setups. Live results will differ due to execution variables.