
US Earnings Outlook | July 22, 2026 | By Manish T., BreakoutBulletin
Market Summary
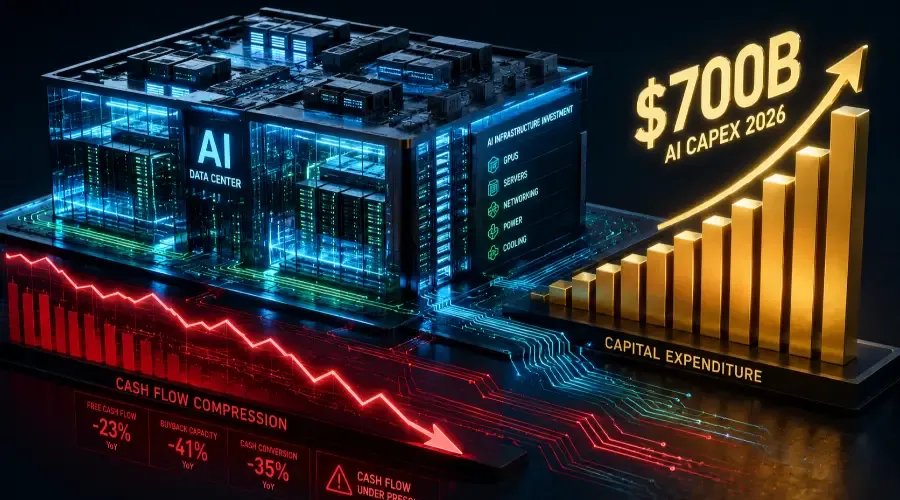
As late-July earnings season arrives, Wall Street is shifting from rewarding speculative AI announcements to demanding evidence of return on the capital being spent. The four major US hyperscalers, Microsoft, Amazon, Alphabet, and Meta, are on track to spend roughly $700 billion in capital expenditure in 2026, with the large majority directed at AI compute infrastructure. The pressure is no longer theoretical: this spend is already compressing free cash flow hard enough to send it negative at Amazon, and the coming reports will test whether that compression triggers broader sector repricing.
Key Takeaways
Historic capital intensity: Combined four-hyperscaler capex is projected near $700 billion in 2026, up roughly 77% from about $410 billion in 2025, and close to 2% of US GDP.
The cash-flow squeeze is real, not projected: The spend is heavy enough that Amazon's free cash flow is expected to turn negative in 2026, directly reducing buyback capacity across the group.
The market already reacted: In the Q1 2026 reports, Amazon fell roughly 6% despite a revenue beat and Microsoft dropped 17%, evidence that investors are repricing on cash flow, not top-line growth.
Cloud monetization divergence: Cloud revenue keeps growing double digits (AWS, Azure, Google Cloud), but rising hardware depreciation and power costs are pressuring net margins.
Supply-chain spillovers: Memory makers, server and chip suppliers, and power and grid providers remain direct structural beneficiaries of the spending wave.
2026 Hyperscaler Capex Breakdown
| Company | Projected 2026 Capex | Primary Investment Focus | Cash-Flow Note |
|---|---|---|---|
| Amazon | ~$200B | AWS AI data centers, custom silicon (Trainium) | Free cash flow projected to turn negative on the buildout |
| Microsoft | ~$190B | Azure AI compute, data center footprint | AI run-rate expanding alongside high component costs |
| Alphabet | ~$175–185B | TPU acceleration, Gemini model scaling | Search resilience helping fund the cloud build |
| Meta | ~$115–135B | GPU clusters, MTIA silicon, open-source LLMs | Capex acceleration reducing near-term net cash generation |
The Fundamental Tension: Growth vs. Cash-Flow Compression
The core issue for mega-cap technology in 2026 is not revenue growth. Cloud providers are still delivering double-digit top-line expansion. The operational challenge is capital intensity, and the single metric that captures it is the ratio of capex to operating cash flow.
When a company reinvests the bulk of its operating cash flow into short-lived hardware, GPUs and servers that depreciate over three to five years, free cash flow contracts sharply. At the extreme, it goes negative, which is exactly what Amazon is now guiding toward. That compression limits dividend growth, shrinks the pool available for buybacks, and raises earnings sensitivity to hardware and power cost inflation.
The chain that matters for valuation:
High revenue growth ──► ~$700B AI capex ──► reduced free cash flow ──► pressure on the multiple
That last link is the one to watch, not assume. Strong revenue can support a rich multiple only while the cash conversion behind it holds. When capex absorbs most of the cash a business generates, the market can begin paying less for each dollar of revenue, and the Q1 reaction in Amazon and Microsoft suggests that repricing has already started.
The market already spoke: In Q1 2026, Amazon fell ~6% despite beating revenue, and Microsoft dropped ~17%. Cash flow, not top-line growth, is now driving the reaction.
Earnings Season Checklist for Active Traders
When the late-July results cross the wire, the top-line beat is the least informative number on the page. Three structural signals carry more:
Sequential capex guidance. Are executives holding or raising full-year capital spend without a matching improvement in cloud operating margins? Rising spend against flat margins is the combination that pressures cash flow.
Cloud operating margins. Compare cloud revenue growth against operating-margin movement. Growth that arrives with margin compression is lower-quality growth than the headline implies.
Capital-return changes. Watch for any pause or reduction in buybacks. A repurchase program getting trimmed to fund data centers is management telling you where the cash is going.
If capex guidance rises without a matching improvement in cloud operating margin, expect the cash-flow repricing to deepen, regardless of the revenue beat.
The Bottom Line
The hyperscalers are making a coordinated bet that AI infrastructure built now pays off later, and each fears underbuilding more than overspending. For traders, the read is not whether the spend is happening, it is, but whether the market keeps financing it patiently. The Q1 reaction showed the patience is thinning: cash flow, not revenue, moved the stocks. The names that pair heavy capex with visible margin discipline and honest capital-return commentary are positioned differently from those raising spend while cash generation erodes. The earnings reports settle which is which.
FAQ
How much are Big Tech companies spending on AI infrastructure in 2026?
The four largest hyperscalers, Amazon, Microsoft, Alphabet, and Meta, are projected to spend roughly $700 billion combined in 2026, up about 77% from around $410 billion in 2025.
Why is Big Tech free cash flow declining despite high profits?
The capital required to build AI data centers, buy GPUs, and secure power is absorbing most of operating cash flow. At Amazon, free cash flow is projected to turn negative in 2026.
Which secondary sectors benefit from high AI capex?
Semiconductor and memory suppliers, server and networking producers, and industrial power and grid providers receive direct order flow from hyperscaler spending.
What should traders watch instead of the revenue beat?
Sequential capex guidance, cloud operating margins, and any reduction in buybacks. Those three signal cash-flow health, which is what the market is now pricing.
Tags: Big Tech earnings, AI capex, Microsoft earnings, Amazon AWS, free cash flow, technology sector analysis, hyperscaler spending
Internal link anchors:
How to Analyze Earnings Reports with AI – https://www.breakoutbulletin.com/article/how-to-analyze-earnings-reports-ai
How to Evaluate Valuation and Financial Ratios Using AI – https://www.breakoutbulletin.com/article/how-to-evaluate-valuation-and-financial-ratios-with-ai
How to Analyze Growth, Margins, and Cash Flow Using AI – https://www.breakoutbulletin.com/article/how-to-analyze-growth-margins-cash-flow-ai
Educational content only. Not investment advice. Capex and cash-flow figures are drawn from company guidance and analyst estimates (CreditSights, Goldman Sachs, CNBC reporting) as of mid-2026; projections change and should be verified before acting. Markets involve risk.
Potential Accuracy Notes
The article states that combined hyperscaler capex will approach $700 billion in 2026 and that this is close to 2% of US GDP. Readers should independently verify both the capex estimates and the contemporaneous US GDP figures used for comparison, as analyst projections may change over time.
The statements regarding Amazon's projected negative free cash flow and the cited Q1 2026 share-price reactions are time-sensitive and should be confirmed against company filings and market data current at the time of reading.