
US Market Structure | July 22, 2026 | BreakoutBulletin
Market Summary
The US IPO market is having its biggest year since the 2021 mania, and it happened fast. Proceeds have reached roughly $141 billion in 2026, within striking distance of 2021's record $142.4 billion, driven by a wave of multi-billion-dollar listings from SpaceX to SK Hynix. For traders, a boom this size is a two-sided signal: it reflects genuine confidence pulling private capital into public markets, and it introduces a supply of new equity that competes for the same dollars already chasing existing names. Reading which force dominates is the useful work.
Key Takeaways
Near-record proceeds: US IPO proceeds reached ~$141.2 billion in 2026, a stone's throw from 2021's record $142.4 billion, according to Renaissance Capital.
A pace unlike prior cycles: PwC data shows traditional IPOs raised ~$114.1 billion through June 30, more than seven times the ~$14.8 billion over the same period in 2025.
Mega-deals drove it: SpaceX alone raised roughly $86.2 billion, and the average deal size nearly doubled year over year to about $526 million (S&P Global).
Broad-based, not single-sector: Deal flow spanned AI infrastructure, industrials, healthcare, and consumer, which distinguishes 2026 from a narrow, one-theme frenzy.
The supply question: A wave of new listings adds equity supply and can pull liquidity and focus toward new names, while post-IPO performance (SPCX, SK Hynix) becomes a real-time gauge of appetite.
How Big This Actually Is
Context makes the number legible. US IPO proceeds ran around $44 billion for all of 2025, itself a recovery year. In the first half of 2026 alone, traditional IPOs raised roughly $114 billion, and the full-year figure now sits near $141 billion, closing on the 2021 record. That is not a gradual recovery. It is a step change.
The pace is what separates 2026 from prior rebounds. PwC noted that H1 proceeds ran more than seven times the same period in 2025, and that even excluding the single largest deal, the remaining total was still nearly three times higher year over year. Prior recovery cycles tended to stall after a strong opening quarter. This one broadened instead, with deal flow spanning AI infrastructure, industrials, healthcare, and consumer sectors rather than concentrating in a single hot category.
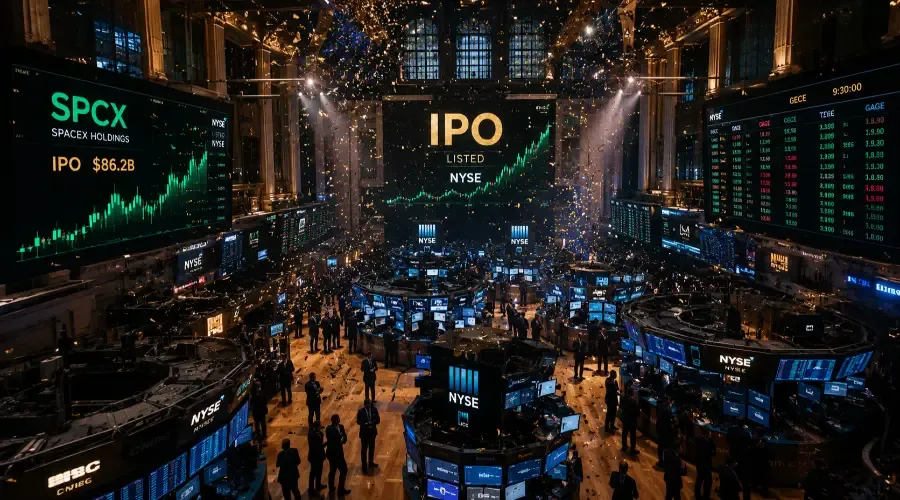
Two headline listings anchor the year. SpaceX raised roughly $86.2 billion, a figure S&P Global put at nearly three and a half times the size of Alibaba's 2014 IPO. SK Hynix followed with a $26.5 billion cross-listing. The average deal size nearly doubled from a year earlier to around $526 million, which tells the real story of 2026: not just more deals, but far larger ones.
Why a Supply Wave Cuts Both Ways
An IPO boom is easy to read as pure bullishness. The more complete read is that it introduces a genuine two-sided dynamic.
On the confidence side, companies and their backers go public when they believe public markets will pay fair or premium valuations. A near-record year signals that private-market capital sees the public window as open and attractive, and that institutional demand is deep enough to absorb very large deals. That is a real vote of confidence in the broader tape.
On the supply side, every dollar raised in an IPO is a dollar of new equity competing for investment. When tens of billions in fresh shares arrive in a compressed window, they can pull liquidity and attention toward new listings and away from existing positions, and they add to the total float the market must absorb. In sectors where several new names list at once, that supply can weigh on valuations even when the underlying businesses are sound. Historically, heavy issuance late in a strong market has also been read by strategists as a sentiment indicator worth watching, because issuers tend to sell into strength.
Neither reading is the whole picture. The boom is simultaneously evidence of confidence and a source of supply pressure, and which one matters more depends on the specific sector and the specific week.
The Real-Time Gauge: Post-IPO Performance
The most useful thing about a supply wave is that it produces its own scoreboard. How the marquee new listings trade after their debuts is a live measure of whether demand is keeping pace with supply.
SpaceX is the clearest test case. After the largest IPO in history, the stock has come well off its early highs and traded back toward its offering price, a de-rating driven partly by the mechanics of a thin float meeting a large lock-up schedule rather than by the business itself. SK Hynix's cross-listing performance is watched as a barometer for appetite in the AI-memory complex specifically. When high-profile listings struggle after strong debuts, it signals that supply is starting to test the limits of demand, which tends to cool the pace of subsequent deals. When they hold, the window stays open and the pipeline keeps pricing.
For traders, that makes the post-IPO tape a leading indicator worth tracking, not just company-specific noise. The performance of this year's largest listings is, in aggregate, the market telling you how much more supply it can absorb.
What to Watch From Here
Three signals carry the most information as the boom runs.
The pipeline's pricing behavior. Whether upcoming deals price at the top of their ranges, get cut, or get pulled entirely reveals where real demand sits relative to issuer expectations.
Sector concentration of new supply. A cluster of listings in one theme, AI infrastructure or space, for example, can create localized supply pressure that weighs on incumbents in the same group.
The lock-up calendars of the mega-deals. The largest 2026 IPOs carry staggered lock-up expirations that will release additional supply into the float over the coming months. Those dates are a scheduled, knowable source of future selling pressure, and they matter most for the names that floated the smallest initial share of their equity.
The Bottom Line
2026's IPO boom is real, large, and broad-based, a near-record year built on genuine confidence and unusually large deals. It is also a mechanical supply event, adding fresh equity and a wave of lock-up-driven float expansion that the market has to digest. The healthy reading and the cautionary reading are both true at once. The tell that separates them is the post-IPO tape: as long as the marquee listings hold and new deals price cleanly, the window stays open. When they stop holding, the same boom that signaled confidence becomes the supply that pressures it.
FAQ
How big is the 2026 US IPO market?
Proceeds have reached roughly $141 billion, near the 2021 record of $142.4 billion, according to Renaissance Capital, driven by mega-listings including SpaceX and SK Hynix.
How does 2026 compare to last year?
PwC data shows H1 2026 traditional IPO proceeds ran more than seven times the same period in 2025, with the average deal size nearly doubling to around $526 million.
Is a big IPO year bullish or bearish for stocks?
Both. It signals confidence pulling private capital public, but it also adds equity supply that competes for the same dollars and can pressure valuations, especially where many deals cluster in one sector.
Why does post-IPO performance matter to other traders?
How marquee listings trade after debut is a real-time gauge of whether demand is keeping pace with supply, which influences how quickly the rest of the pipeline prices.
What is lock-up expiration and why does it matter here?
Lock-ups restrict insiders from selling for a set period after an IPO. When they expire, additional shares hit the float, a scheduled source of supply that matters most for deals that floated only a small slice of their equity.
Internal link anchors:
SPCX: The Battleground Between Valuation Compression and the Lock-Up Clock – https://www.breakoutbulletin.com/article/spcx-stock-valuation-lockup-clock
How to Evaluate Valuation and Financial Ratios Using AI – https://www.breakoutbulletin.com/article/how-to-evaluate-valuation-and-financial-ratios-with-ai
How to Do Fundamental Stock Screening with AI – https://www.breakoutbulletin.com/article/fundamental-stock-screening-ai-workflow
How to Build a Daily Watchlist Using AI Sector Analysis – https://www.breakoutbulletin.com/article/ai-sector-analysis-watchlist-guide
What AI Is Not Good at for Traders – Honest Limitations – https://www.breakoutbulletin.com/article/ai-trading-limitations-risks
Educational content only. Not investment advice. Figures are drawn from Renaissance Capital, PwC, S&P Global, and J.P. Morgan reporting as of mid-2026; market data changes, so verify against current sources before acting. Markets involve risk.